Summary
Data from the October 2023 Prosper study reveals that consumer preferences vary by product category, influenced by income and demographics. An overview of the report’s key findings sheds light on the growth of retail membership clubs and shopper behaviors. Understanding these insights is important for retailers to know more about evolving consumer preferences to strengthen membership programs.
- Retail membership clubs, like Amazon Prime, Walmart+, and Costco, have experienced substantial growth, offering consumers exclusive benefits for a membership fee.
- Unlike traditional store loyalty card programs, membership clubs require a fee, setting them apart as a distinct retail format.
- Over 61% of American adults carry at least one store loyalty card, with an average of 3.1 cards, primarily in grocery retailing.
- Costco stands out as an exception, as it has always mandated membership for store access.
- Data for this report is derived from the October 2023 Prosper monthly study, comprising 8,103 adults aged 18 and older.
- Consumer preferences vary by product category, with department stores being favored for men’s and women’s clothing.
- Income levels and demographics play a significant role in club choice, with Costco members having higher incomes, while Walmart+ is favored by Millennials.
- Family usage patterns are similar for Amazon Prime and Walmart+, with a majority reporting one to two family members utilizing the membership.
- Retail club members, especially Walmart+ members, are more likely to engage in contactless retail activities, potentially due to their appeal to Millennials.
- Reasons for membership vary, but both Amazon Prime and Walmart+ members cite free shipping as the primary reason, followed by access to streaming services and deals.
Retail Membership Clubs: Part One
By Dr. Martin Block, Professor Emeritus, Northwestern University, Retail Analytics Council
Retail membership clubs have grown in recent years. A membership club requires the consumer to pay a fee to become a member in exchange for additional benefits. Three membership clubs are considered here, Amazon Prime, Walmart+, and Costco. The fee is one of the primary distinguishing features of a membership club from a store loyalty card program, which has been available for many years, primarily in grocery retailing. Over 61% of all American adults carry at least one store loyalty card, with an average of 3.1 cards. An exception to a long history of retail membership is Costco, which has always required membership to enter the store. The data comes from the online Prosper monthly study collected in October 2023 (n=8,103) of adults 18+.
Retail Format History
Respondents are asked to name their favorite retailer across several product categories. The favorite is categorized into groups as shown in Table 1. Discount stores include Walmart and Target. Department stores include Macy’s. Grocery stores include Kroger and Aldi. The Internet is primarily Amazon. While membership warehouses include Costco and Sam’s Club. Specialty stores depend on the electronics category including Best Buy, Men’s clothing includes Men’s Warehouse, among others, and Women’s clothing includes Victoria’s Secret, among others. Many specialty clothing retailers cater to both genders. Examples of grocery stores are Kroger and Aldi. Drugstore examples are CVS and Walgreens.
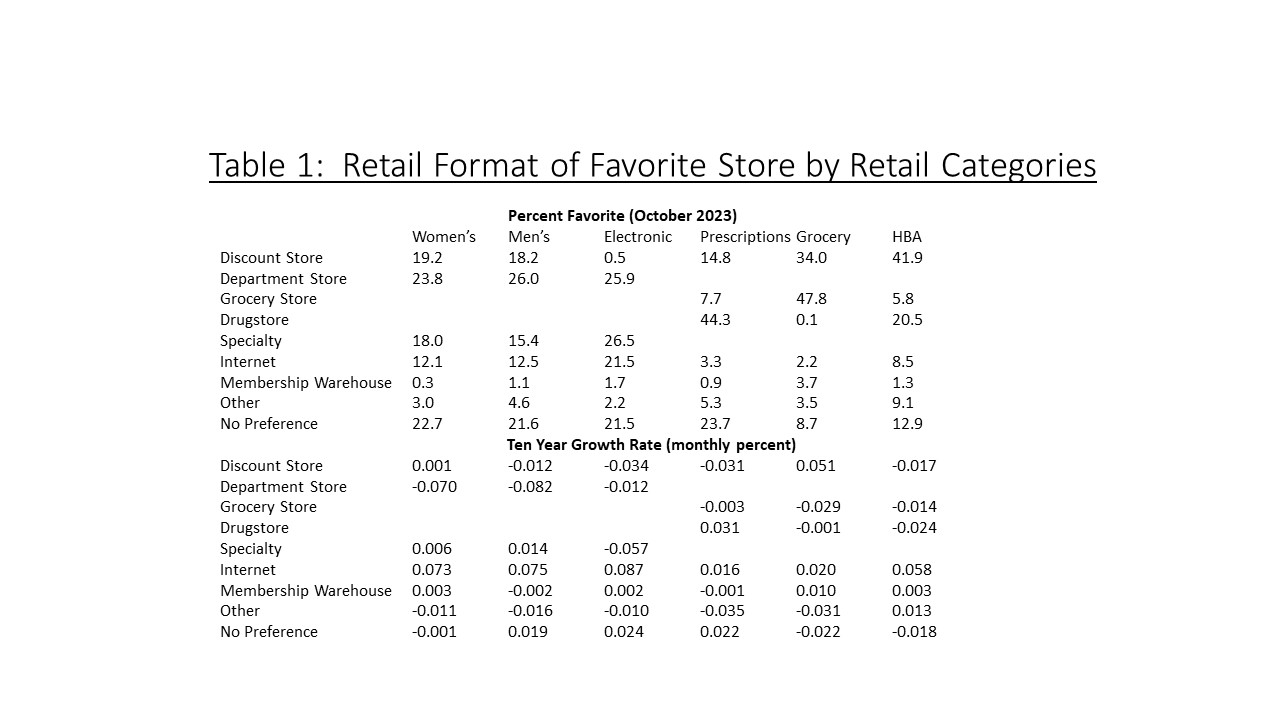
As of October 2023, the favorite type of retailer for men’s and women’s clothing is the department store, followed by the discount store, specialty store, and internet. Specialty stores, department stores, and the Internet lead electronics. The drugstore dominates prescription drugs. Grocery is dominated by the grocery store, followed by the discount store. Membership warehouses are strongest in the discount category. Health and Beauty Aids (HBA) is dominated by the discount store followed by the drug store.
The data has been collected well over ten years since September 2010 by month. Calculating the monthly growth rate across the 158 months for each format and retail category is also shown in Table 1. An average annual growth rate can be obtained by multiplying the rates by 12. Growth is shown in percentages. The Internet enjoys the highest growth across all the selected retail categories, especially electronics and clothing. Department stores show the largest declines. Discount stores show declines, except in grocery stores. It is worth noting that “no preference” for a favorite store represents a large proportion, especially in the less frequently purchased categories such as clothing and electronics, which have remained relatively flat.
The Membership Club Shopper
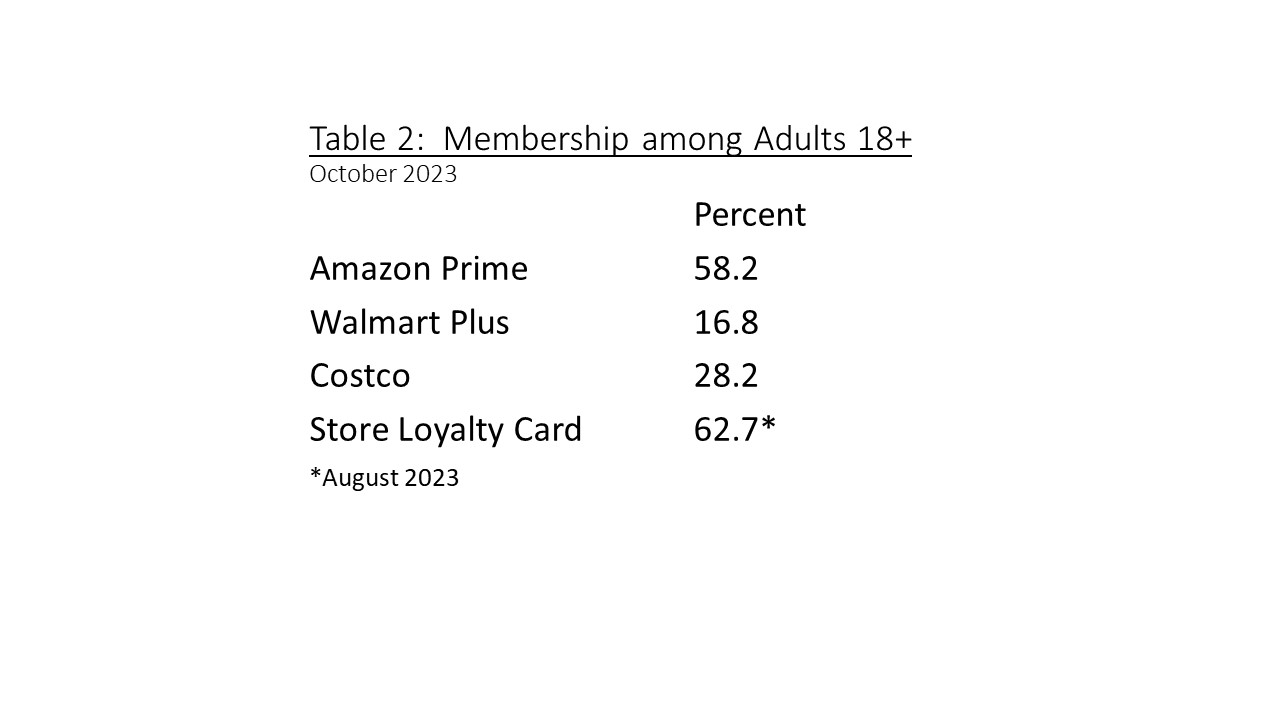
Almost three out of five (58.2%) of adult respondents report using Amazon Prime as shown in Table 2. Walmart+ lags at 16.8%. Costco is used by 28.2%. This is compared to the proportion that report having at least one store loyalty card at 62.7%. It should be noted that there is considerable duplication among the clubs. For example, 35.2% of Amazon Prime members also have Costco and 22.2% also have Walmart+.
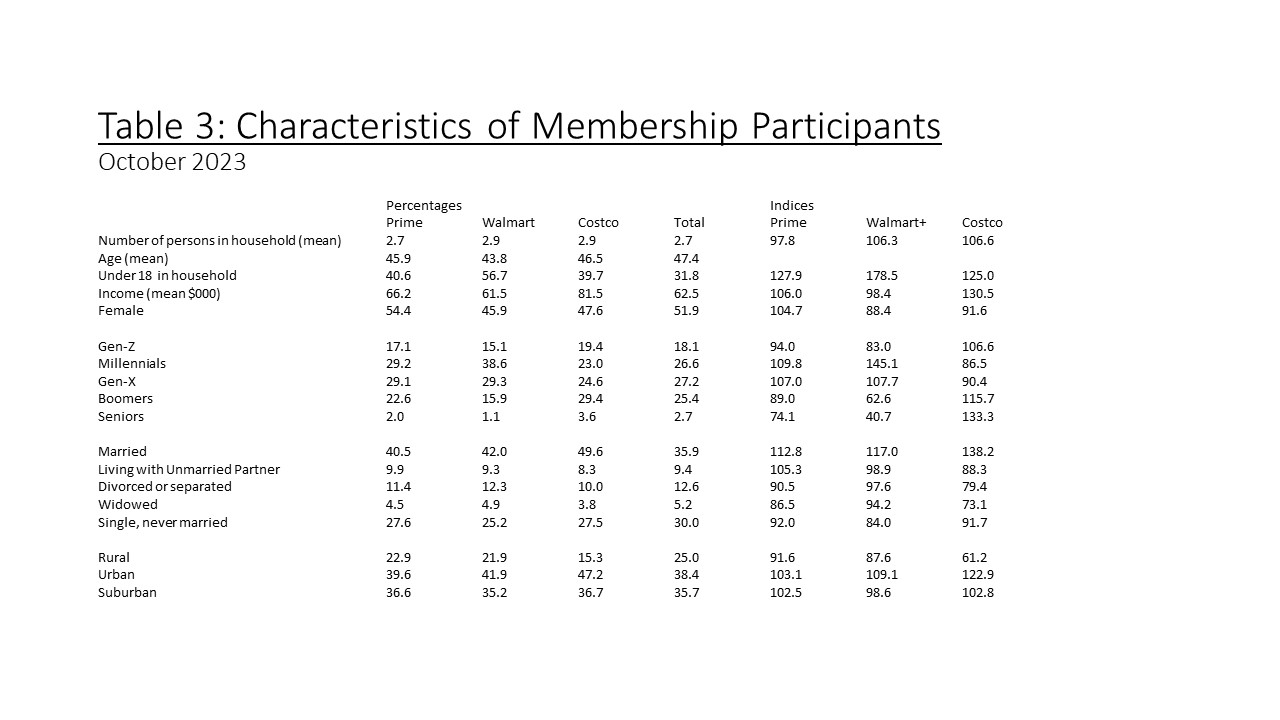
 Household average income is a big determinant of store preferences as shown in Table 3. The values on the left indicate the summary for each of the three clubs and the total sample. The values on the right are an index relative to the total sample. Costco has an income index of 130 and an average household income of $81,200 compared to the overall average of $62,500. Walmart+ is the lowest, with an average household income of $61,500. All three clubs show a high proportion of households with members under 18. Walmart is especially favored by Millennials, and Costco by Boomers and Seniors. Seniors are very low among Amazon Prime. Shopping club members tend to be married, especially Costco. Costco is low among divorced or separated and widowed. Costco is also high among urban residents.
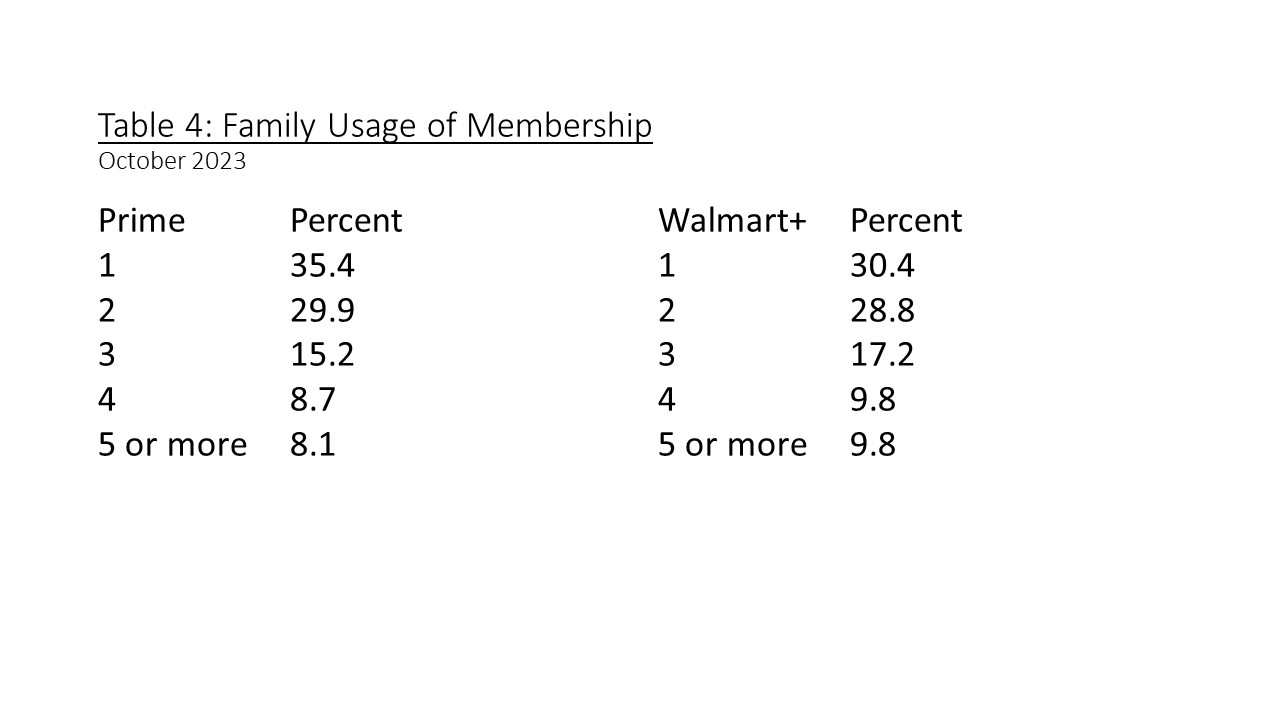
The pattern of family usage of the membership between Amazon Prime and Walmart+ is almost identical, as shown in Table 4. The percentages are based on the total number of members. Approximately three out of five say the membership is used by either one or two family members. All Walmart+ members surveyed report being a member for two years or less, while 67% of Amazon Prime members report being a member for three years or longer.
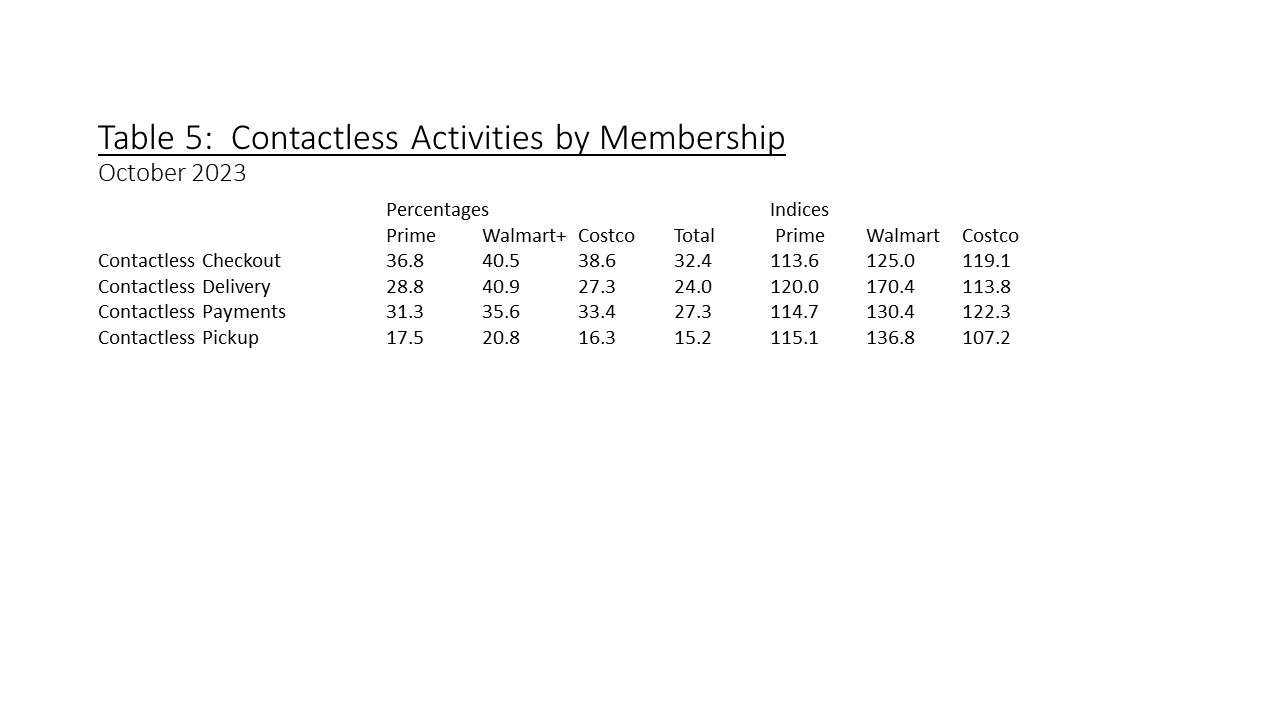
Retail members are also more likely to report using contactless retail activities, as shown in Table 5. This is especially true for Walmart+ members, which may relate to the popularity among Millennials. Even though the indices are higher for Amazon Prime, it indicates that they use contactless activities when shopping elsewhere.
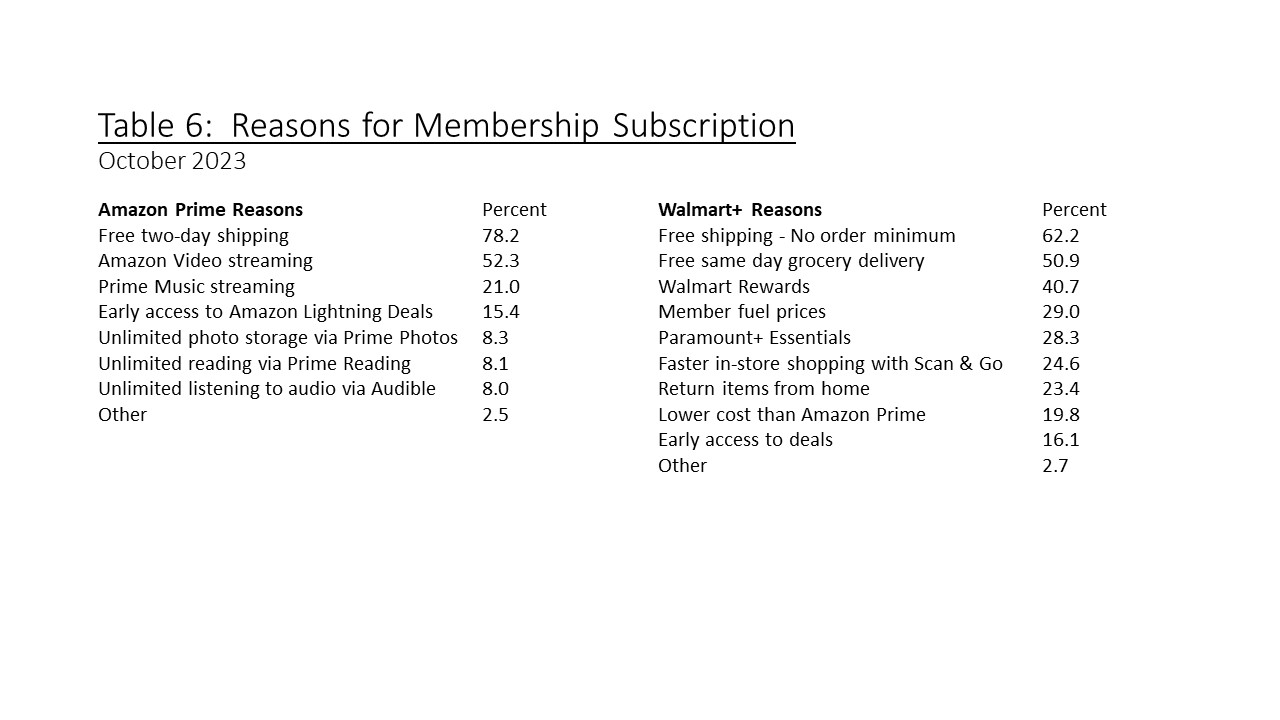
 Respondents were asked their reasons for membership description. A comparison between Amazon Prime and Walmart+ is shown in Table 6. Respondents were not asked about Costco. The percentages are among those that subscribe, and multiple reasons could be selected. Free shipping is the overwhelming single reason for both. Access to streaming services is high on both lists, with Paramount+ Essentials listed on Walmart+. Both show access to deals as a reason. Walmart+ has store-related reasons such as Scan & Go. Interestingly, 19.8% of Walmart+ subscribers said they chose Amazon because of lower costs.
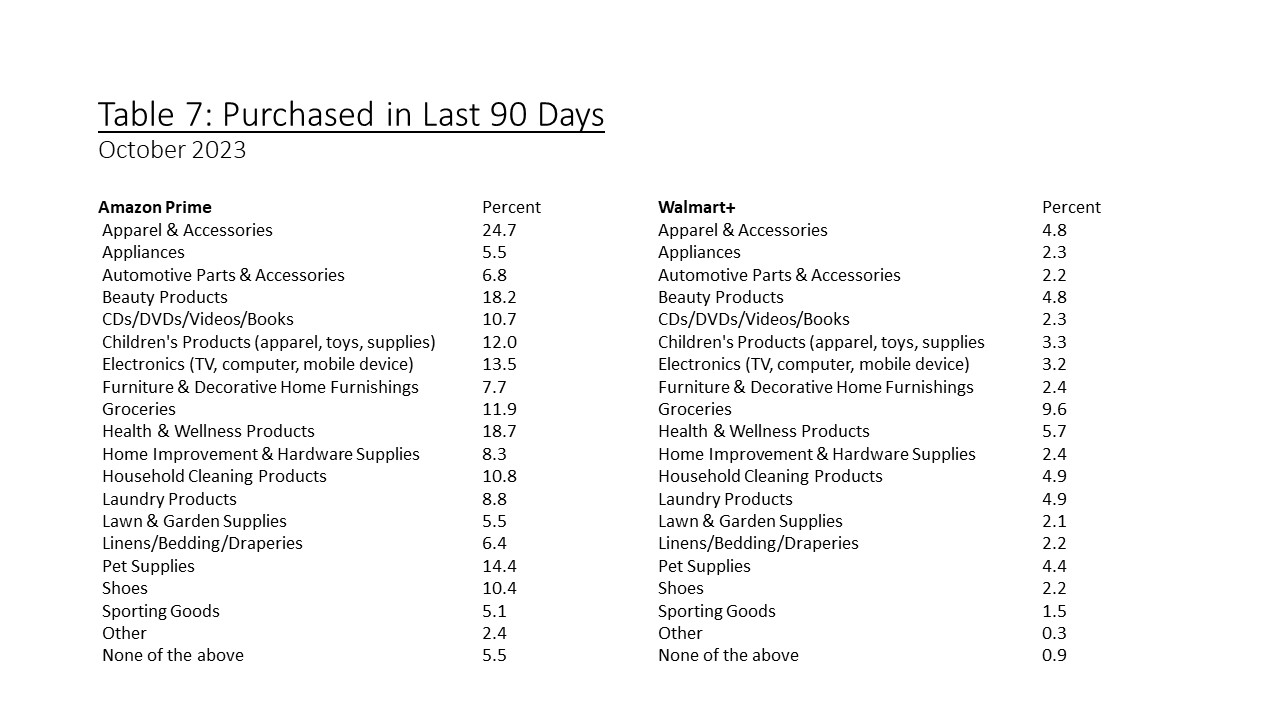
 Respondents also reported purchases made in the last 90 days using the membership services, as shown in Table 7. The base for both is the total sample. Amazon Prime members lead their list with apparel and accessories at 24.7%, followed by health and wellness products and beauty products. Groceries are the leading category for Walmart+ at 9.6%, but this still trails Amazon Prime, which claims 11.9%. The following groceries for Walmart+ are health and wellness products and household cleaning and laundry products. Pet supplies are relatively high for both.
The Economy and COVID-19
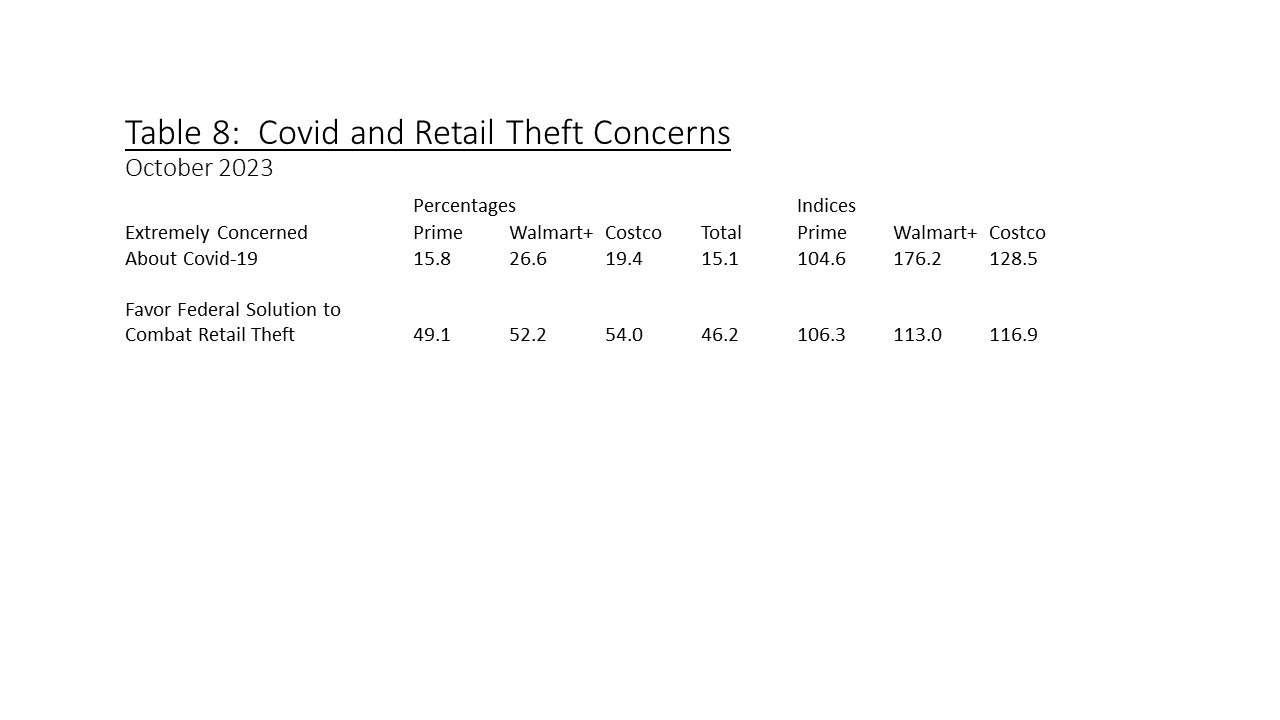
Several external factors relate to retail membership. Respondents were asked if they favor federal legislation to solve organized retail theft. As shown in Table 8, 46.2% agreed. Perhaps using this as a proxy for concern over retail theft, this federal solution was more likely to be favored by Walmart+ and Costco members, no doubt because of the physical retail store. The same pattern can be seen over extreme concern over COVID-19, with the higher rate indicated by the indices for the store-based retailers Walmart+ and Costco. It looks to be the case that COVID-19 is of greater relative concern than retail theft.
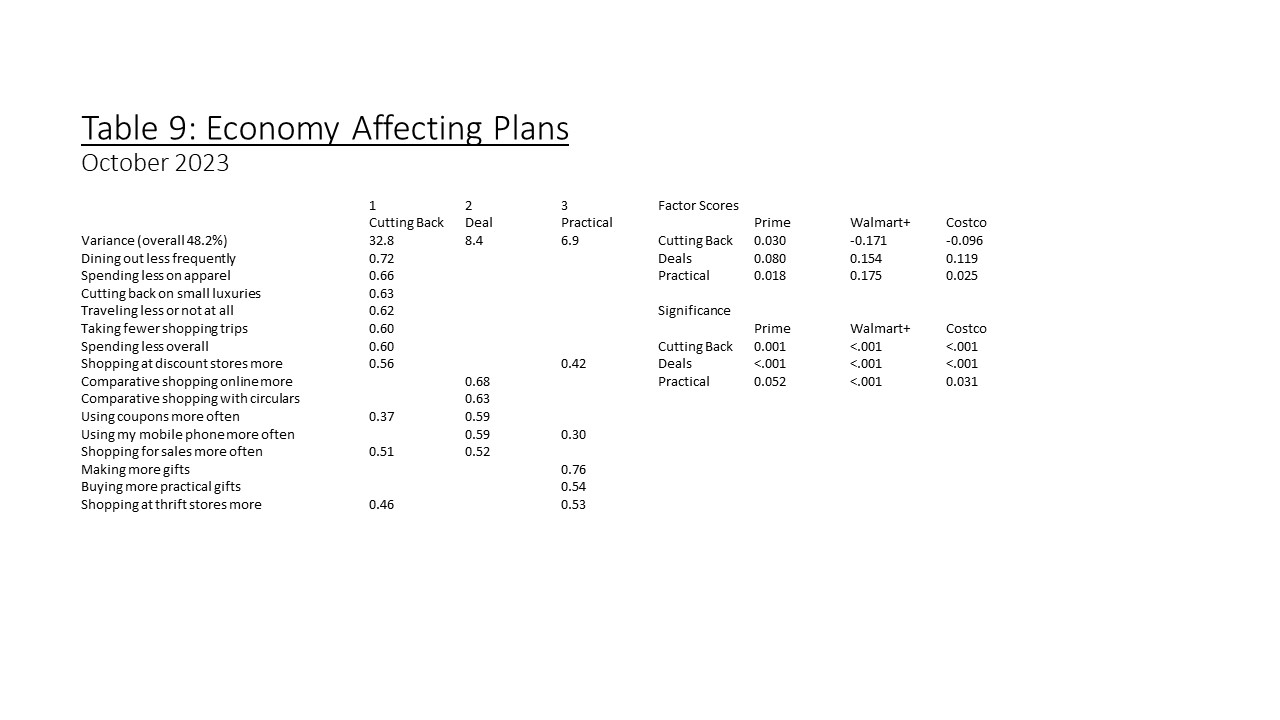
 In addition, respondents were also asked a series of 17 yes or no questions: “Is the current state of the US economy affecting your household spending plans in any of the following ways?” Only 15.9% of the total reported that the state of the US economy is not affecting household spending plans. To simplify the comparison across retail membership groups, a factor analysis was performed on the sequence of questions, as shown in Table 9. Three factors were extracted. The first, labeled “cutting back,” explains 32.8% of the variance. The second, labeled “deal,” explains 8.4% of the variance and includes more comparative shopping, coupons, and sales. The third, labeled “practical,” explains 6.9% of the variance and includes making more practical gifts and shopping at thrift stores more. The factor scores (standard deviation units) are shown in Table 9 on the right. Relatively, Prime members are most likely to differ on deals. The significant probabilities for the difference between members are shown. Walmart+ members are less likely to be cutting back, more interested in deals, and more likely to be practical. Costco members are also less likely to cut back and are more interested in deals.
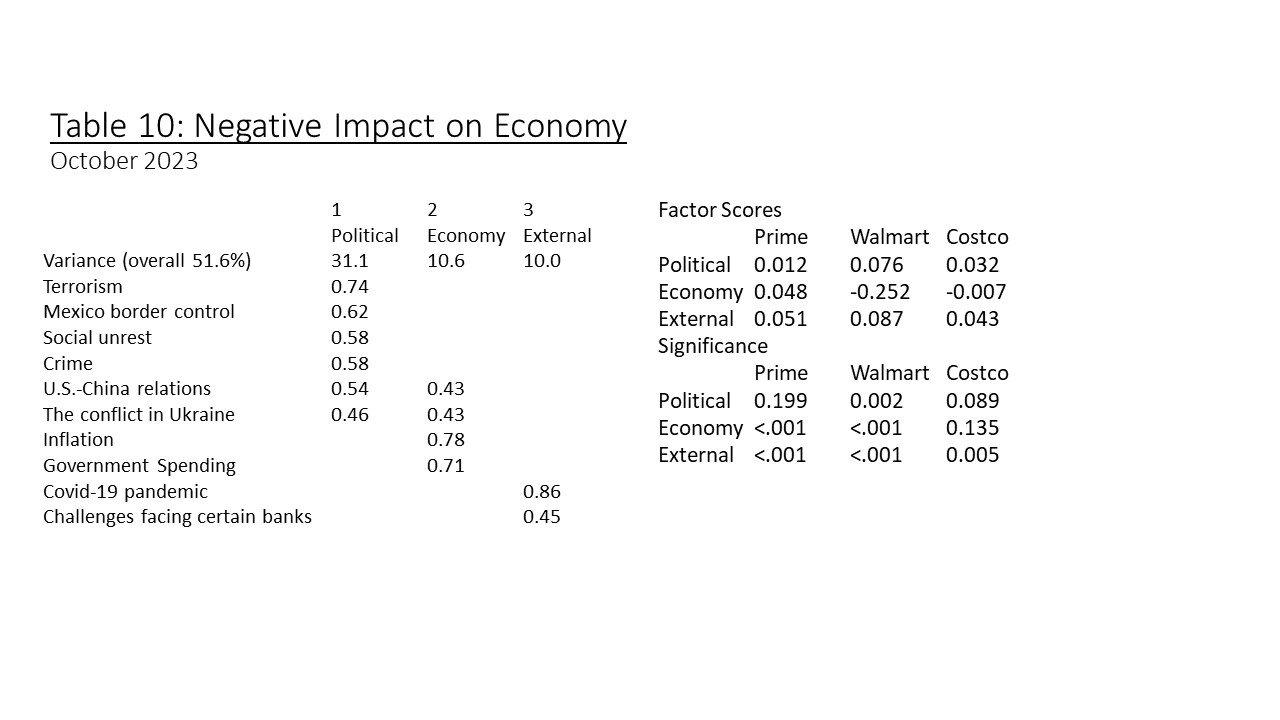
 Respondents were asked if any of a list of 12 factors had a negative impact on their view of the US Economy. The questions were yes or no, with 10.9% reporting none. A factor analysis again yielded three factors, as shown in Table 10. The first factor, labeled “political,” explains 31.1% of the variance. It includes terrorism, social unrest, and crime. The second factor, labeled “economy,” explains 10.6% and includes inflation and government spending. The third factor, labeled “external,” is primarily COVID-19. Comparing across membership groups, both Prime and Walmart+ exhibit significant differences for both political issues and the economy, although Walmart+ is less concerned about the economy. Amazon Prime members are significantly different in their view of political issues. Costco members hold the same views as non-members but are slightly more concerned about COVID-19,
 Streaming Services
Streaming services are strongly connected to retail memberships, with Amazon Prime and Walmart offering them as a benefit.
The retail membership landscape, dominated by Amazon Prime, Walmart+, and Costco, reflects shifting consumer preferences and behaviors. Notably, while traditional store loyalty cards persist, the fee-based model of membership clubs has gained traction, with over 61% of Americans carrying loyalty cards. Insights into favorite retailers, income demographics, and evolving shopping patterns offer valuable guidance for retailers navigating the competitive membership club market.
In the upcoming “Retail Membership Clubs: Part Two,” the focus will explore member and non-member data, offering an in-depth look into patterns and behaviors exhibited by individuals within and outside retail membership clubs. By analyzing the demographics, spending habits, and preferences of both groups, the Retail Analytics Council will share more about how members and non-members contribute to the evolving dynamics of the retail market.
