Executive Summary:
St. Patrick’s Day emerges as a flourishing American celebration, gaining popularity and showcasing notable trends in consumer behavior. The latest Prosper Insights & Analytics survey conducted in February 2025 reveals insights into participation rates, spending habits, and the demographics of celebrators.
- St. Patrick’s Day participation remains strong, with 61.8% of people planning to celebrate, ranking it between Halloween and Valentine’s Day.
- Celebration trends have stabilized after a post-pandemic rebound, maintaining a steady level above 61% over the past few years.
- Wearing green (79.4%) is the leading activity, followed by dinners, social activities, and parties (28.2%). Decorating a home or office is reported by 1 in 4, with attending a parade lower on the list.
- Food and beverages lead to spending categories, with over half of celebrators purchasing food and 43.5% buying beverages. Apparel and decorations follow as key spending areas.
- Nearly one in five celebrators (19.6%) plan to spend in a department store.
- Spending primarily occurs in grocery stores and discount stores, with bars/restaurants and department stores also playing a role.
- Celebrating St. Patrick’s Day appears to be strongly related to generation, with Gen-Z, Millennials, and Gen-X leading the celebrations at 61.3%.
- Planned spending has seen consistent growth, with an average spend of $48.04 for those planning a party in 2025, slightly lower than in 2024.
The data underscores that those celebrating St. Patrick’s Day contribute to increased consumer activity and are more engaged in retail and lifestyle spending.
Gen-Z, Millennials, and Gen-X drive St. Patrick’s Day Spending
By Dr. Martin Block, Professor Emeritus, Northwestern University, Retail Analytics Council
St. Patrick’s Day has become a popular American holiday of the culture. St. Patrick’s Day is among the topics covered by Prosper Insights & Analytics, which conducts monthly online surveys that collect data about annual events and related market behavior. St. Patrick’s Day celebration was asked in the February 2025 survey (n=8,568). In response to the question, “Will you celebrate St. Patrick’s Day this year, 61.8% of all adults said yes. As shown in Table 1, St. Patrick’s Day ranks between Halloween and Valentine’s Day. This is almost identical to 2024.
Table 1: Seasonal Holiday Participation.
| Month | Holiday | Percent |
| January | Super Bowl | 77.6 |
| February | St. Patrick’s Day | 61.8 |
| Valentines Day | 55.5 | |
| Easter | Celebrate Easter | 80.7 |
| May | Mother’s Day | 84.2 |
| June | Father’s Day | 75.4 |
| Graduation | 33.6 | |
| July | 4th of July | 87.2 |
| Back to School | 40.1 | |
| October | Halloween | 72.4 |
| November | Thanksgiving Shopping | 74.3 |
| December | Winter Holidays | 92.8 |
| Christmas | 85.3 |
Recent St. Patrick’s Day History
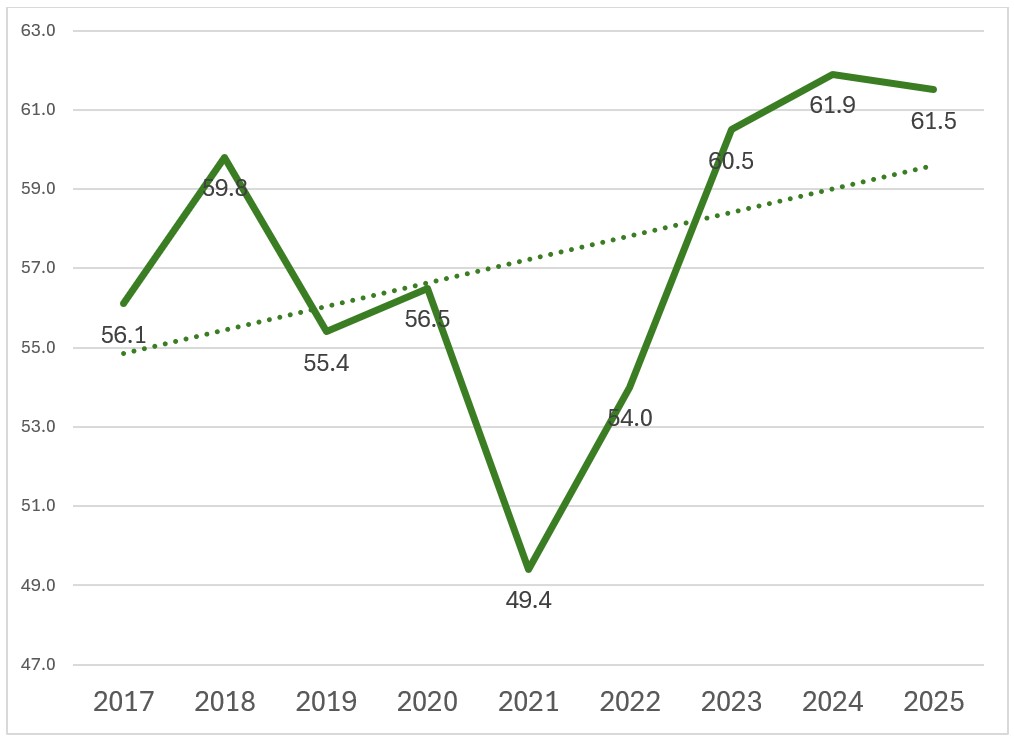
The rate of anticipated celebration of St. Patrick’s Day has increased slightly over the past nine years, as shown In Figure 1. The rate dropped in 2021, no doubt related to COVID-19, and has increased steadily since. It now has reached a steady state at just over 61%.
Figure 1: St. Patrick’s Day Celebration
Plans for celebrating St. Patrick’s Day are shown in Table 2. Wearing green is the leading activity, followed by dinners, social activities, and parties. Decorating a home or office is reported by 1 in 4, with attending a parade well down the list. These are almost identical to the reported planned activities in 2024.
Table 2: Celebration Plans.
| Percent | |
| Wear green | 79.4 |
| Make a special dinner | 28.2 |
| Attend a party at a bar/restaurant | 26.8 |
| Decorate home or office | 24.1 |
| Attend a private party | 16.3 |
| Attend a parade | 15.0 |
| Host a party | 11.7 |
Food and beverage dominate spending plans among those celebrating St. Patrick’s Day, as shown in Table 3. Apparel or accessories and decorations are second to edibles. Greeting cards and gifts are relatively unimportant compared to other holidays.
Table 3: Planned St. Patrick’s Day Spending.
| Percent | |
| Food | 51.9 |
| Beverages | 43.5 |
| Apparel or accessories | 32.1 |
| Decorations | 25.4 |
| Candy | 17.2 |
| Greeting cards | 7.5 |
| Gifts | 5.4 |
As shown in Table 4, most of the planned spending will be in a grocery or discount store. Again, almost identical to 2024.
Table 4: Where Will St. Patrick’s Day Spend Occur.
| Percent | |
| Grocery Store | 38.5 |
| Discount Store | 29.1 |
| Bar/Restaurant | 19.8 |
| Department Store | 19.6 |
| Online | 14.7 |
| Local/Small Business | 10.7 |
| Specialty Store (Greeting Card/Gift Store, Electronics Store) | 7.2 |
| Specialty Clothing Store | 7.0 |
| Drug Store | 5.7 |
| Catalog | 1.1 |
St. Patrick’s Day Celebrators
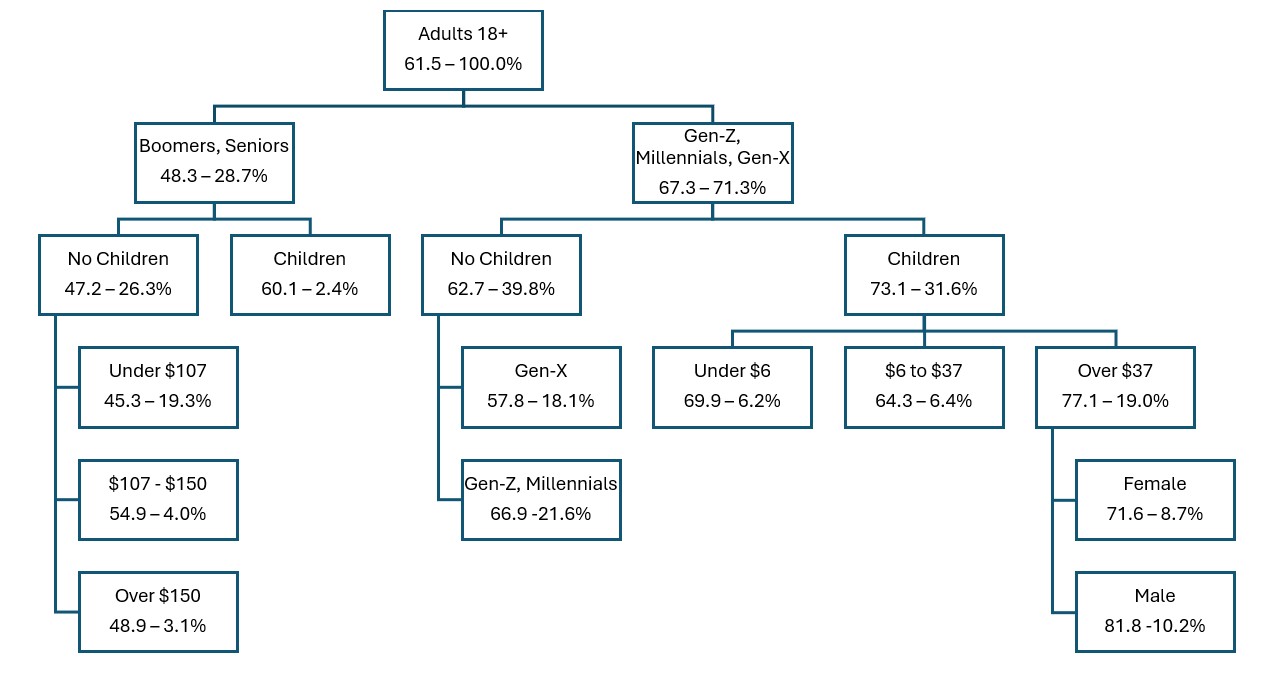
A classification regression tree (CRT) is a reasonable way to determine some of the characteristics of the St. Patrick’s Day celebrator. Using the overall proportion of 61.5%, gender, generation, income, presence of children, and marital status are used to estimate the relative proportion in a tree. Figure 2 shows the first split by generation, Boomers and Seniors at 48.3% and Gen-Z, Millennials and Gen-X at 61.3%. Celebrating St. Patrick’s Day appears to be strongly related to generation. The variables explaining the tree are shown by their relative importance in Table 5. The importance is shown as the average proportion change, followed by a percentage calculated by the top variable generation. Income and the presence of children are the next most important variables.
Table 5: Importance of Demographic Predictors of Celebrators.
| Independent Variable | Importance | Normalized Importance |
| Generation | 0.018 | 100.0 |
| Income | 0.005 | 25.4 |
| Children | 0.004 | 24.6 |
| Gender | 0.002 | 10.1 |
| Marital Status | 0.001 | 7.7 |
Figure 2: St. Patrick’s Day Celebrators Segmentation Tree
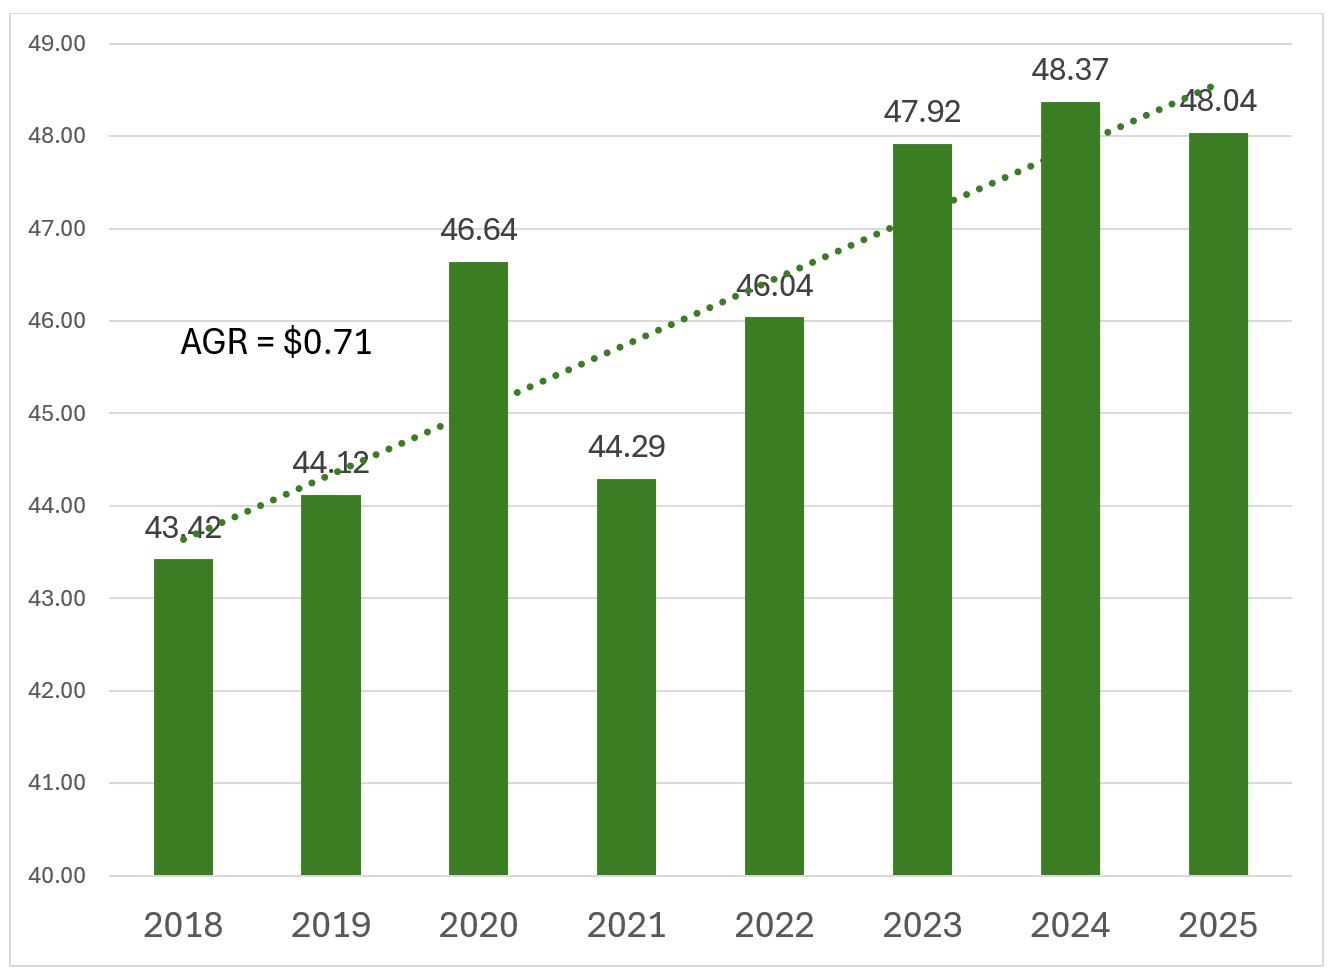
The planned spending has steadily increased, as shown in Figure 3. The 2025 planned average spend for those celebrating is $48.04, with an average annual growth rate of $0.71. Celebrators anticipate a slight 0.7 decrease for essentially the same items over 2024.
Figure 3: Average Planned Spend.
Respondents were asked if they planned any major purchases within the next six months, compared to those planning to celebrate St. Patrick’s Day, as shown in Table 6. An index is calculated comparing the proportion planning a purchase among those celebrating St. Patrick’s Day to all adults. In every category, the celebrators out-plan the overall with an average index of 121.8. The highest index is stereo equipment, with an index of 132.1. The one exception is vacation travel, which indexes just below 99.0.
Table 6: Purchase Plans in the Next 6 Months, 2025
| Celebrate | All | Index | |
| Computer | 15.2 | 13.3 | 114.3 |
| Mobile Device | 12.4 | 10.6 | 117.0 |
| Home Appliances | 12.2 | 9.9 | 123.2 |
| TV | 12.0 | 10.2 | 117.6 |
| Furniture | 11.0 | 9.2 | 119.6 |
| Major Home Improvement or Repair | 10.2 | 8.8 | 115.9 |
| Smartwatch | 8.2 | 6.5 | 126.2 |
| Jewelry/Watch | 8.0 | 6.3 | 127.0 |
| House | 5.6 | 4.5 | 124.4 |
| Stereo Equipment | 3.7 | 2.8 | 132.1 |
| DVD/Blu-ray Player | 3.3 | 2.6 | 126.9 |
| Digital Camera | 2.7 | 2.1 | 128.6 |
| RV/Boat | 2.4 | 1.9 | 126.3 |
| Digital Voice Assistant (Amazon Echo, Google Home) | 2.2 | 1.7 | 129.4 |
| Vacation Travel | 19.0 | 19.2 | 99.0 |
| Average | 8.5 | 7.3 | 121.8 |
Summary
St. Patrick’s Day ranks between Halloween and Valentine’s Day. Celebrating the day has increased over the last nine years. Spending is also up for essentially the same items as last year. Generation is the strongest predictor of planning to celebrate. Celebrators plan to buy more and shop more.