Executive Summary
Dining out remains a near-universal behavior among U.S. adults, with restaurant usage, spending, and preferences shaped by household composition, income, and perceptions of food quality and convenience. Findings from the November 2025 Prosper Insights & Analytics survey (n=8,000) show that more than nine in ten adults have eaten at a restaurant in the past 90 days, with consumers visiting a wide range of establishments and cuisines. Spending patterns reveal sharp differences between households with and without children. At the same time, analytical modeling confirms that food quality overwhelmingly drives restaurant recommendations across both fast food and full-service formats, outweighing factors such as technology, deals, and ambiance.
- 6% of U.S. adults ate at a restaurant in the past 90 days, visiting an average of 4.69 different restaurants
- McDonald’s is the most frequently visited restaurant, with 40.1% of adults reporting a visit in the past 90 days
- American cuisine dominates restaurant choice (53.2%), followed by Mexican (30.1%), Chinese (25.1%), and Italian (22.0%)
- 8% of adults used carryout or delivery, while 40.7% report regular or occasional use of third-party delivery services
- Average monthly restaurant spending totals $236.45, representing 4.4% of average income
Food Quality Dominates Restaurant Choice and Spending
By Dr. Martin Block, Professor Emeritus, Northwestern University, Retail Analytics Council
Dining out (eating at a restaurant) is nearly a universal activity among U.S. Adults 18+. The Prosper Insights and Analytics monthly online survey for November 2025 (n=8,000) shows that 90.6% have eaten in at least one restaurant within the past 90 days. Table 1 lists the 51 most popular restaurants by the percentage reported visiting. The average number of different restaurants reported is 4.69. By far the most frequently visited is McDonald’s with 40.1% of all adults eating there at least once within the past 90 days. It should be noted that many of the named restaurants are geographically concentrated so that the visit percentages may appear to be lower than they would be with in their trading areas. Consumer appears to enjoy variety in their restaurant selection.
Table 1: Restaurants in the Past 90 Days
| Percent | Percent | |||
| McDonald’s | 40.1 | Cracker Barrel | 7.0 | |
| Chick-fil-A | 24.7 | Papa John’s | 6.9 | |
| Burger King | 23.9 | In-N-Out Burger | 6.6 | |
| Taco Bell | 20.8 | Sonic | 6.5 | |
| Domino’s | 18.9 | Raising Cane’s | 6.2 | |
| Wendy’s | 18.1 | IHOP | 5.7 | |
| Starbucks | 16.4 | Five Guys Burgers and Fries | 5.5 | |
| Dunkin’ Donuts | 14.7 | Jack-In-The-Box | 5.4 | |
| Locally owned restaurant | 14.4 | Denny’s | 5.4 | |
| Subway | 14.2 | Jimmy John’s | 4.8 | |
| KFC | 13.4 | Outback Steakhouse | 4.5 | |
| Chipotle | 13.2 | Whataburger | 4.3 | |
| Pizza Hut | 12.7 | Hardee’s/Carl’s Jr. | 4.2 | |
| Arby’s | 11.4 | Firehouse Subs | 4.1 | |
| Applebee’s | 11.3 | Checkers/Rally’s | 3.7 | |
| Local pizza shop/restaurant | 10.2 | Waffle House | 3.3 | |
| Little Caesars | 10.2 | Bojangles | 3.3 | |
| Dairy Queen | 9.4 | Red Lobster | 3.0 | |
| Olive Garden | 9.4 | Shake Shack | 2.6 | |
| Popeyes | 9.2 | Moe’s Southwest Grill | 2.6 | |
| Chili’s | 9.1 | Qdoba | 2.0 | |
| Panera Bread | 9.0 | TGI Friday’s | 1.9 | |
| Panda Express | 8.3 | Smashburger | 1.8 | |
| Buffalo Wild Wings | 7.3 | Fatburger | 1.8 | |
| Jersey Mike’s Subs | 7.2 | Tim Hortons | 1.6 | |
| Culver’s | 7.2 |
Respondents were also asked about the types of restaurants they had eaten at in the past 90 days. Table 2 shows that American cuisine is the overwhelming first choice, followed by Mexican, Chinese, and Italian. Note that the question does not distinguish between fast food (quick service) and full-service restaurants.
Table 2: Restaurant Types in the Past 90 Days
| Percent | |
| American (ranging from traditional diners to contemporary casual fare) | 53.2 |
| Mexican | 30.1 |
| Chinese | 25.1 |
| Italian | 22.0 |
| Japanese | 9.0 |
| Indian | 6.5 |
| Greek | 6.2 |
| Mediterranean | 6.1 |
| French | 5.9 |
| Caribbean | 5.5 |
| Cajun/Creole | 5.1 |
| Thai | 5.0 |
Nearly half (46.8%) report using a home-delivery or carry-out service. About a fourth (26.5%) say they use restaurants more than delivery services. Delivery through third-party services (e.g., DoorDash, Grubhub, Uber Eats) is reported to be used regularly by 13.1% and occasionally by 27.6%, leaving 59.3% who report never using them.
Restaurant Spending
Determining monthly spending levels requires dividing the restaurant into categories: full-service with a waiter or waitress, fast food, and pizza. Excluded are stores that may serve food, such as convenience stores, coffee shops and grocery stores. As shown in Table 3, the amount spent each time for fast food and pizza is approximately half that of full service. Fast food has the highest frequency, occurring approximately once per week. Expanding to dollars yields an overall average total of $236.45. This represents 4.4% of the average income. Full service accounts for nearly half of the spending (45.1%), as shown in Table 3.
Table 3: Spend Monthly Estimates
| Amount/Time | Times/Month | Month Total | Total
Percent |
|
| Full Service | 28.40 | 2.7 | 106.68 | 45.1 |
| Fast Food | 15.03 | 4.0 | 74.16 | 31.4 |
| Pizza | 15.46 | 2.5 | 55.61 | 23.5 |
| Total Spend | 236.45 |
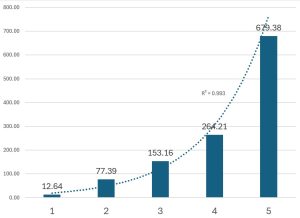
Figure 1 shows the quintiles of total restaurant spending. The growth in spending follows an almost perfect exponential curve, indicating that spending increases very rapidly after the fourth quintile. The range in the reported data begins with zero or no spending to a high of $3,520. This shows that a small portion of people are responsible for a large portion of spending.
Figure 1: Total Monthly Restaurant Spending ($) Quintiles
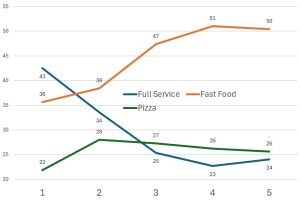
The composition of the total restaurant spending changes as shown in Figure 2. Note that, across overall spending quintiles, Full service spending increases and fast food spending decreases as a percentage of total spending. The percentage of pizza spending remains approximately the same.
Figure 2: Category of Restaurant Percentages by Overall Spending Quintiles
A classification regression tree (CRT) identifies the demographic characteristics of monthly restaurant spending. The first split is having children, which divides the total $236.45 into two groups: those with children at $336.74 for 36.2% and those without children at $179.51 for 63.8%. Figures 3 and 4 show the two sub-trees starting at the child divide.
Figure 3: CRT Total Spending Sub-Tree for Those Having Children
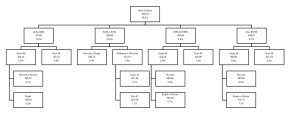
Beyond having children, the most important variable is household income. The lowest income node is under $25k, to the highest income node at over $105K. This is followed by marital status, with nodes reporting being married are generally higher. Living with an unmarried partner is combined with being married in a few nodes.
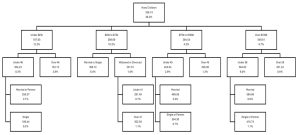
For those with no children, as shown in Figure 4, a similar pattern is observed, with household income being the most important variable, ranging from under $25k to over $150k. Marital status is also important, again dividing between married and single. Although marital status is slightly more complicated, with divorced and widowed becoming a node. Age is also very important, with a divide generally in the mid-forties. An exception is in the highest income group, where the divide is ten years older at 58.
Figure 4: CRT Total Spending Sub-Tree for Those Having No Children
Predicting Restaurant Preferences
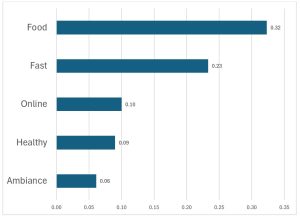
The reasons for eating at a fast-food restaurant are abstracted from a list of thirty items using factor analysis to make it easier to understand. The factors are shown in Table 4; the five resulting factors account for 35.5% of the variance in the original list. It is worth noting that delivery service, being open late, and value menus did not load as factors in any of the five factors. The first factor, named Food, comprises quality, trustworthiness, portion size, price, selection, and taste, and accounts for 9.7% of the variance. This is followed by online offerings, including loyalty rewards, special offers, and mobile and online ordering. Healthy consists of clean ingredients (e.g., antibiotic-free, non-GMO, no artificial flavors, etc.), and healthy and organic menu items. Fast consists of drive-thru, fast service and location. Ambiance consists of advertising, ambiance, and décor. The last four factors explain just over 6% each.
Table 4: Factor Analysis of Fast Food Reasons
| Food | Online | Healthy | Fast | Ambiance | |
| Percent of Variance | 9.66 | 6.70 | 6.61 | 6.31 | 6.18 |
| Quality of Food | 0.72 | ||||
| Trustworthy Establishment | 0.63 | ||||
| Portion Size | 0.58 | ||||
| Price | 0.57 | ||||
| Menu Selection | 0.46 | ||||
| Appealing Taste | 0.43 | ||||
| Loyalty Rewards | 0.66 | ||||
| Mobile App Ordering | 0.59 | ||||
| Coupon/Special Offer | 0.59 | ||||
| Online Ordering | 0.44 | ||||
| Clean Ingredients | 0.56 | ||||
| Healthy Menu Options | 0.54 | ||||
| Organic Menu Options | 0.45 | ||||
| Drive-thru | 0.73 | ||||
| Fast Service | 0.69 | ||||
| Location | 0.40 | ||||
| Advertising | 0.60 | ||||
| Ambiance | 0.59 | ||||
| Decor of the Restaurant | 0.47 |
To assess the relative importance of these factors, a simple regression was performed to predict the likelihood of recommending the restaurant to a friend. The analysis shown in Figure 5 is statistically significant with R = 0.43. Clearly, food is the most important factor, followed by speed. The remaining three, online, healthy, and ambiance, are much less important.
Figure 5: Fast Food Factors Predicting Recommendation – Beta Coefficients
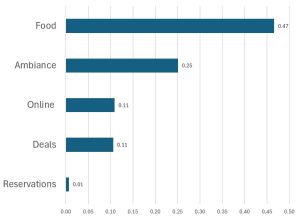
The same analysis was conducted for full-service restaurants. As shown in Table 5, the five factors account for 37.3% of the variance. The first factor, which explains 12.1%, is very similar to the fast-food first factor; both are named Food. In full service, however, friendly wait staff and appealing taste have been added. The second factor, online, also includes gluten-free and organic options, delivery services, late hours, and child-friendly features, and accounts for 8.0%. Ambiance includes cleanliness as well as décor and explains 7.6%. Deals include coupons, special offers, and loyalty rewards, and explains 5.2%. Reservations are associated with trustworthiness and are relatively unimportant.
Table 5: Factor Analysis of Full Service Reasons
| Food | Online Ordering | Ambiance | Deals | Reservations | |
| 12.10 | 7.95 | 7.62 | 5.23 | 4.40 | |
| Quality of Food | 0.69 | ||||
| Price | 0.63 | ||||
| Portion Size | 0.61 | ||||
| Menu Selection | 0.59 | ||||
| Friendly Service | 0.58 | ||||
| Location | 0.54 | ||||
| Friendly Wait Staff | 0.52 | ||||
| Appealing Taste | 0.49 | ||||
| Online Ordering | 0.57 | ||||
| Mobile App Ordering | 0.56 | ||||
| Gluten Free Menu Options | 0.52 | ||||
| Delivery Service | 0.48 | ||||
| Open Late | 0.47 | ||||
| Kid Friendly | 0.45 | ||||
| Organic Menu Options | 0.45 | ||||
| Ambiance | 0.56 | ||||
| Clean Ingredients | 0.52 | ||||
| Cleanliness | 0.52 | ||||
| Decor of the Restaurant | 0.52 | ||||
| Coupon/Special Offer | 0.75 | ||||
| Special Offers/Discounts | 0.53 | ||||
| Loyalty Rewards | 0.43 | ||||
| Reservations Taken | 0.54 | ||||
| Trustworthy Establishment | 0.47 |
Figure 6 presents a regression analysis similar to the prior Fast Service analysis. The regression is also significant with R2 = 0.55. Food is by far the most important, nearly doubling second-place ambiance. Food is also more important for full-service restaurants than for Fast-Food Restaurants. Ambiance moves up to second place from last place in Fast Food.
Figure 6: Full-Service Factors Predicting Recommendation – Beta Coefficients
Summary
Dining out remains nearly universal among US adults, but how and where consumers choose to eat is shaped less by technology or promotions and more by fundamentals. Data indicate that food quality is the strongest driver of restaurant recommendations across both fast-food and full-service dining, outweighing speed, convenience, deals, and digital features. Spending and usage patterns vary significantly by household structure and income, but regardless of format, consumers reward restaurants that get the food quality right.