Executive Summary:
Prosper Insights & Analytics, in cooperation with the National Retail Federation (NRF), has been surveying consumers for over 20 years on their seasonal retail shopping plans. Easter ranks between the Super Bowl and Mother’s Day in popularity among American celebrations. Over the past nine years, there has been a slight decrease in the observance of Easter, with participation declining from 80.7% in 2024 to 79.2% in 2025. While overall consumer spending has decreased slightly, planned spending on Easter-related items has increased across most categories. Factors such as the presence of children, age, and income strongly influence individuals’ likelihood of celebrating Easter. Easter celebrants are more likely to engage in increased shopping activity, particularly online. Additionally, those planning to celebrate Easter consistently report higher happiness levels than non-participants.
- Easter is America’s second most popular religious holiday, with 79.2% of adults planning to celebrate in 2025.
- Popular Easter activities include cooking a holiday meal, visiting family and friends, attending church, and participating in Easter egg hunts. Church attendance and family visits have declined slightly over the past eight years.
- Spending on Easter-related items has increased in most categories. Notably, spending on decorations has grown the most, increasing by 8% annually.
- Candy (92.0%) and food (89.3%) are the most common planned purchases, with average spending of $29.14 and $66.74, respectively.
- Discount stores are the primary destination for Easter spending, followed by department stores and online retailers. Online shopping continues to show the highest growth rate among retail channels.
- Demographic factors such as the presence of children, age, and income are the strongest predictors of celebrating Easter. Families with children, younger individuals (Millennials and Gen-Z), and higher-income households ($75K-$100K and above) are most likely to celebrate.
- Those who plan to celebrate Easter report higher happiness levels across various aspects of life, including government, work, religion, and love life. Satisfaction with the government saw the most notable increase compared to 2024.
Despite Tradition, Easter Shoppers Prioritize Sweet Treats Over Sentimental Staples
By Dr. Martin Block, Professor Emeritus, Northwestern University, Retail Analytics Council
Easter is the second most popular religious American holiday. Celebrating Easter is among the topics covered by Prosper Insights & Analytics, in cooperation with the National Retail Federation (NRF), in the monthly online surveys that collect data about annual events and related market behavior. Celebrating Easter was asked in the March 2025 survey (n=7,970). In response to the question, “Will you celebrate Easter this year?” 79.2% of all adults said yes. As shown in Table 1, Easter ranks between Mother’s Day and the Super Bowl.
Table 1: Seasonal Holiday Participation (Percent).
| Percent | |
| Christmas | 93.4 |
| 4th of July | 87.2 |
| Mother’s Day | 84.0 |
| Celebrate Easter | 79.2 |
| Super Bowl | 76.9 |
| Father’s Day | 75.3 |
| Halloween | 73.1 |
| St. Patrick’s Day | 61.9 |
| Valentines Day | 52.0 |
Recent Easter Celebration History
The Easter celebration rate has decreased slightly over the past nine years, as shown in Figure 1. The rate dropped sharply in 2021, no doubt related to COVID-19, and has a slight decrease at -0.11 per year. The rate has dropped again in 2025 from 80.7 to 79.2. Considering the last 14 years the rate has increased by an average of 0.16%.
Figure 1. Celebrate Easter Trends.
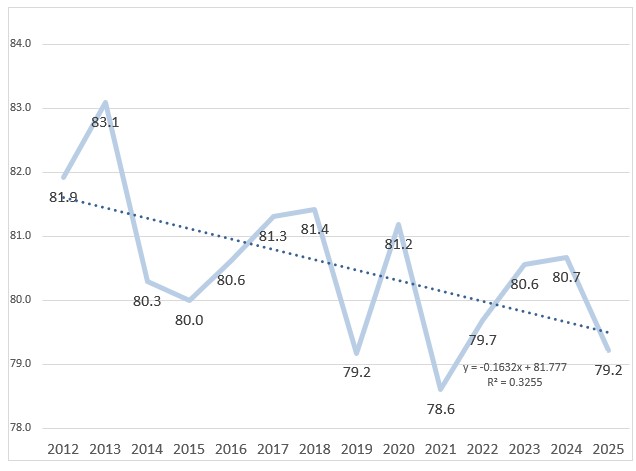
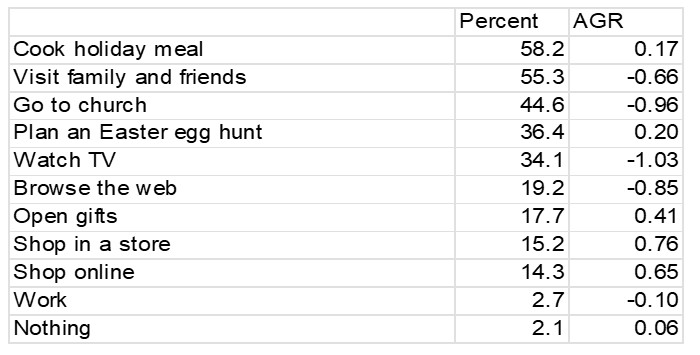
Table 2 shows plans for celebrating Easter. Cooking a holiday meal is the leading activity, followed by visiting family and friends and going to church. An Easter egg hunt is planned for over one out of three. Visiting family and friends and attending church have declined compared to the last 8 years.
Table 2: Celebration Plans (Percent).
Candy and food dominate spending plans among those celebrating Easter, as shown in Table 3. Almost every planned category shows an increase, consistent with the slight increase in decorations leading the way in celebrating the holiday. The only decreasing category is greeting cards. Food is the leading category in terms of average spending and the leading annual growth rate.
Table 3: Percent Purchasing and Average Amount Among Celebrators
| Percent | AGR% | Spend | AGR$ | |
| Decorations | 50.5 | 1.22 | $26.58 | .52 |
| Flowers | 43.2 | 0.70 | $35.31 | .94 |
| Gifts | 64.5 | 0.61 | $47.37 | 1.01 |
| Candy | 92.0 | 0.57 | $29.14 | 0.67 |
| Food | 89.3 | 0.57 | $66.74 | 1.73 |
| Clothing | 49.0 | 0.32 | $58.05 | 0.11 |
| Other | 22.0 | 0.24 | $30.51 | .11 |
| Greeting Cards | 43.1 | -0.41 | $19.62 | .63 |
Nearly one in five (19.4%) report plans to spend more for Easter in 2025, on par with last year (19.7%); compared to nearly one in six (15.2%) planning to spend less, the same as 2024. In 2024, consumers were asked why, as shown in Table 4. In 2024, the primary reason for spending more was higher prices, whereas having less money and trying to save money overall were the primary reasons for spending less.
Table 4: 2024 Spending Plans and Reasons (Percents).
| Spending More | 19.7 | Spending Less | 15.2 |
| Higher prices on Easter-related items or gifts | 56.2 | Have less money this year | 45.7 |
| I’m planning a bigger celebration this year | 30.2 | Trying to save more money overall this year | 45.5 |
| I am buying for more people | 24.1 | Too worried about the state of the economy | 30.8 |
| Have more money this year | 21.3 | Lower prices on Easter-related items or gifts | 13.3 |
| Buying more overall because of retailer discounts | 19.0 | Retailers are offering better discounts this year | 4.9 |
| I am seeing fewer retailer discounts | 11.9 | Other | 4.6 |
| Other | 3.3 | None of the above | 9.6 |
| None of the above | 2.0 |
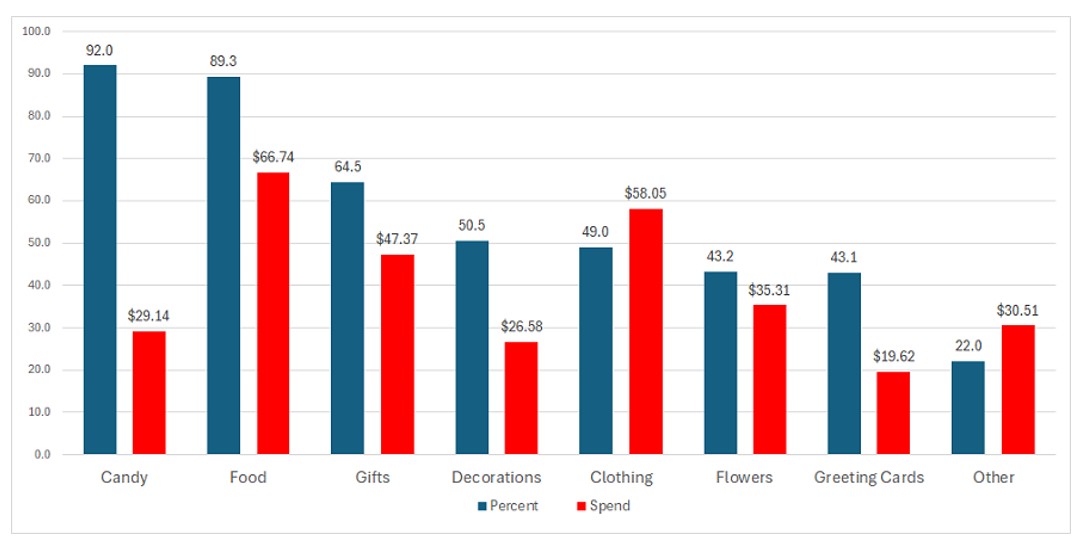
Among Easter celebrators, spending on candy is planned by 92.0%, with an average planned spend of $29.14, as shown in Figure 2. This is followed by food at 89.3%, gifts at 64.5%, decorations at 50.5% and clothing at 49.0%. Interestingly, flowers and greeting cards are only planned by 43%.
Figure 2: Percent Purchasing and Average Spend Among Celebrators
Those planning to celebrate Easter also indicated what inspires them when they shop for Easter-related items. Table 5 shows that tradition is the most important factor, followed by social activity. Sales or promotions and store displays and decorations are also important. Social activity, sales or promotions, store displays, and exclusive products all increased in 2025 compared to 2024.
Table 5: Easter-related Purchase Inspiration (Percents).
| 2024 | 2025 | |
| Tradition | 64.3 | 63.2 |
| It’s a social activity with family or friends | 31.9 | 31.7 |
| Sales or promotions | 29.2 | 35.7 |
| Store displays and decorations | 21.4 | 26.3 |
| Exclusive or seasonal products | 20.5 | 25.9 |
| Retailer or brand events | 11.5 | 12.1 |
| Other | 1.3 | 1.2 |
| None of the above | 7.1 | 6.0 |
Figure 3: Planned Purchased and Annual Growth Rate.
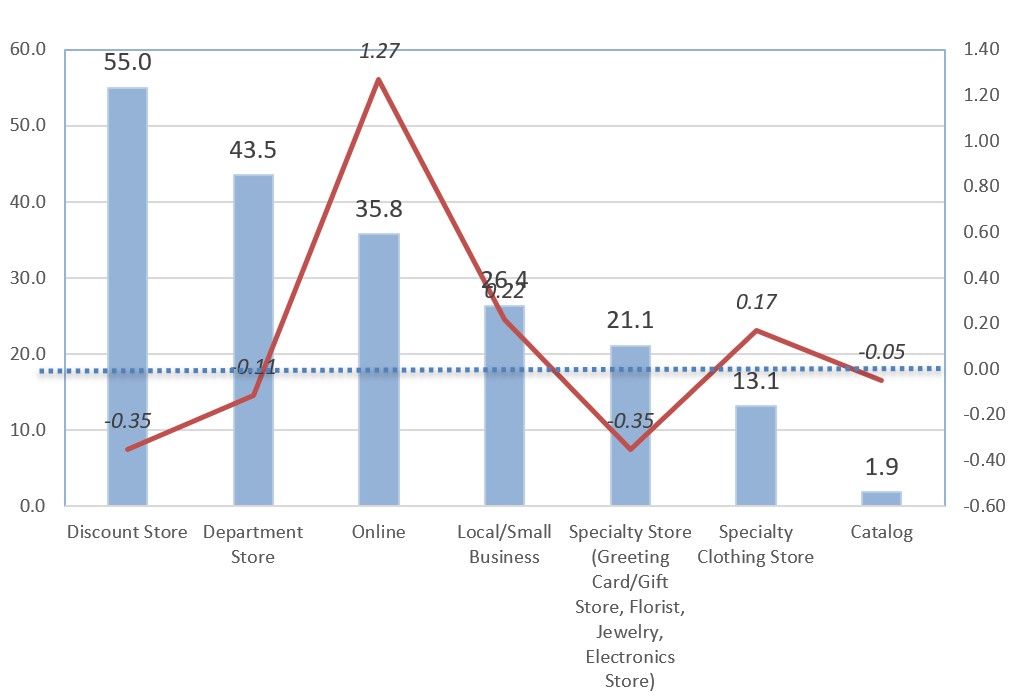
The largest category of planned spending will be in a discount store, followed by a department store and online, as shown in Figure 3. Based on an 8-year history, annual growth rates are also shown. The dotted line shows that the growth rate falls below zero. Clearly, online shows the highest growth rate. Local businesses and specialty stores are showing growth. Discount, department, and specialty stores (not clothing) show declines.
Easter Celebrators
A classification regression tree (CRT) is a reasonable way to determine some of the characteristics of the Easter celebrators. Table 6 shows the relative importance of the variables in predicting the Easter celebration, with the presence of children as the most important, followed by Age and income.
Table 6: Easter Celebrators CRT Summary.
| Independent Variable | Importance | Normalized Importance |
| Children | 0.006 | 100.0 |
| Age | 0.004 | 57.5 |
| Income | 0.002 | 34.3 |
| Female | 0.001 | 17.0 |
As shown in Table 7, having children generates the largest index when comparing Easter celebrators to the total population. The highest income category is $75K to $100K, and over $100K. The income categories shown are in quintiles. The ages are younger, with Millennials followed by Gen-Z. Being married is also a strong predictor of celebrating.
Table 7: Summary Characteristics of Easter Celebrators (Percents).
| Yes | No | Total | Index | |
| Under $15k | 19.1 | 23.9 | 20.1 | 95.0 |
| $15k to $35K | 15.8 | 18.8 | 16.4 | 96.3 |
| $35K to $75k | 28.1 | 25.8 | 27.7 | 101.4 |
| $75k to $100k | 12.0 | 9.9 | 11.6 | 103.4 |
| Over $100k | 24.9 | 21.6 | 24.3 | 102.5 |
| Gen-Z | 19.5 | 17.2 | 19 | 102.6 |
| Millennials | 26.7 | 22.4 | 25.8 | 103.5 |
| Gen-X | 27.4 | 26.2 | 27.1 | 101.1 |
| Boomers | 24.6 | 31.1 | 25.9 | 95.0 |
| Seniors | 1.8 | 3.2 | 2.1 | 85.7 |
| Children | 35.2 | 18.9 | 31.9 | 110.3 |
| Male | 46.2 | 52.7 | 47.6 | 97.1 |
| Female | 53.8 | 47.3 | 52.4 | 102.7 |
| Married | 41.7 | 31.9 | 39.7 | 105.0 |
| Living with an Unmarried Partner | 8.2 | 7.2 | 8.0 | 102.5 |
| Divorced or separated | 10.8 | 14.9 | 11.6 | 93.1 |
| Widowed | 4.6 | 5.9 | 4.9 | 93.9 |
| Single, never married | 30.3 | 36.6 | 31.6 | 95.9 |
Happiness
Respondents are asked to rate their overall happiness across ten categories on a five-point scale. Table 8 shows the proportion of the combination of happy and totally happy. The unmistakable conclusion is that those who plan to celebrate Easter are happier than those who do not, as shown in the composite average. The biggest differences are in government, work, religion, and love life. Compared to 2024, happiness with the government has increased the most.
Table 8: Happiness by Easter Celebration (Percents).
| Yes | No | Total | 2025 Index | 2024 Index | |
| government | 28.7 | 17.6 | 26.4 | 108.7 | 103.5 |
| work | 45.3 | 35.3 | 43.2 | 104.9 | 103.5 |
| religion | 59.4 | 46.8 | 56.8 | 104.6 | 104.9 |
| love | 55.7 | 44.0 | 53.3 | 104.5 | 104.0 |
| health | 58.4 | 48.7 | 56.4 | 103.5 | 102.7 |
| family | 68.4 | 57.4 | 66.2 | 103.3 | 102.9 |
| friends | 65.4 | 55.9 | 63.4 | 103.2 | 102.3 |
| neighborhood | 62.5 | 53.0 | 60.6 | 103.1 | 102.6 |
| home | 67.7 | 58.7 | 65.8 | 102.9 | 102.0 |
| house | 63.5 | 55.9 | 62.0 | 102.4 | 102.1 |
| Composite | 57.5 | 47.3 | 55.4 | 103.8 | 103.0 |
Summary
Easter ranks between the Super Bowl and Mother’s Day. Celebrating the day has decreased slightly in the last eight years. Spending is also down slightly. The presence of children, age, and income are the strongest predictors of planning to celebrate. Celebrators plan to buy more and shop more. They are more likely to shop online as well. Easter celebrators are also happier than those who don’t plan to celebrate.