Summary:
This article discusses retail shrinkage on the rise, largely attributed to theft, prompting retailers to secure items; however, recent data suggests that this short-term loss prevention approach could lead to significant long-term losses.
- Retail shrinkage is up, mostly due to theft.
- Retailers are responding by locking up items.
- New data suggests that short-term loss prevention could result in substantial long-term losses.
- Less than half of shoppers will buy a locked-up item from the store.
- About a third of shoppers are unlikely to continue to shop at the store!
- Contactless checkout and payment is linked to the likelihood of not returning to the store.
- Contactless checkout and payment are most preferred by Gen Z and Millennials, the targets most prized by most retailers.
- Contactless checkout and payment is linked to the likelihood of not returning to the store.
- Retailers need to balance loss prevention with shopper experience to preserve customer lifetime value.
Retail Theft and Consumers
By Dr. Martin Block, Professor Emeritus, Northwestern University, Retail Analytics Council
The National Retail Federation (NRF) estimates that $100 billion was lost in 2022 to retail shrinkage. By far, the largest proportion of this loss is due to retail theft. The shrinkage amounts to about 1.5% of the total over $7 trillion in retail sales in the U.S. To put this in context, the typical net margin for retail is in the range of 3% to 3.5%. Many retailers have responded to retail theft by locking up items to avoid theft.
Locked-up Items
The impact this may have on consumers has been largely ignored until the August 2023 Prosper monthly survey (n=8,185). In the online survey of adults 18+, 27.3% report seeing locked-up items often, and another 34.1% report seeing locked-up items occasionally. This leaves only 38.5% of those who have yet to see any locked-up items. The phenomenon is most closely associated with urban areas, as shown in Table 1. Nearly twice as many consumers in urban areas have seen locked items as those living in rural areas. The population density is using DOD definitions from zip codes.
Table 1.

Encountering locked-up items profoundly impacts the consumer’s purchase decision regarding the locked-up item, as shown in Table 2. Just over two out of five say they go ahead and purchase the item. This leaves the majority, just under three out of five, that go elsewhere or forego the purchase. The largest alternative is purchasing online.
Table 2.

The reaction to locked-up items varies by generation. Millennials and Gen X are the most likely to purchase the item, whereas Seniors are the least likely, as shown in Table 3. Both Gen Z and Millennials are the most likely to purchase at another store or purchase the item online.
Table 3.
Continue Shopping at the Store
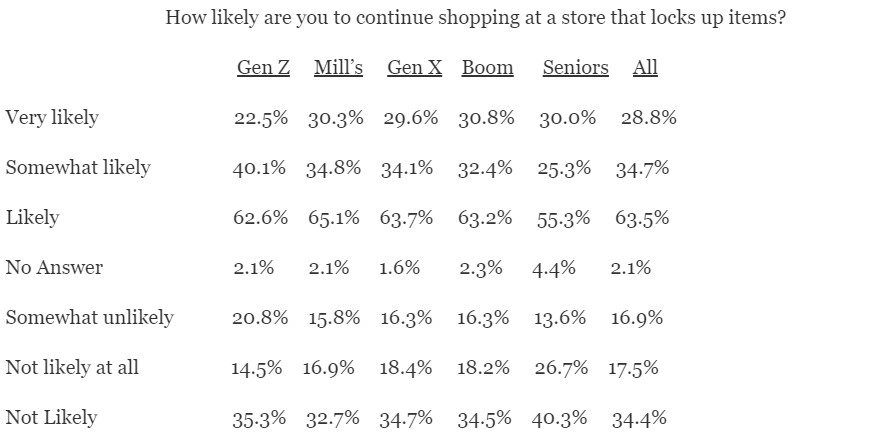
About three out of five say they are either very or somewhat likely to shop again at the same store where they encountered locked-up items. Just over one-third say they are either somewhat unlikely or not all likely to return to the store, as shown in Table 4. Only Seniors indicate a slightly elevated level of not returning to the store.
Table 4.

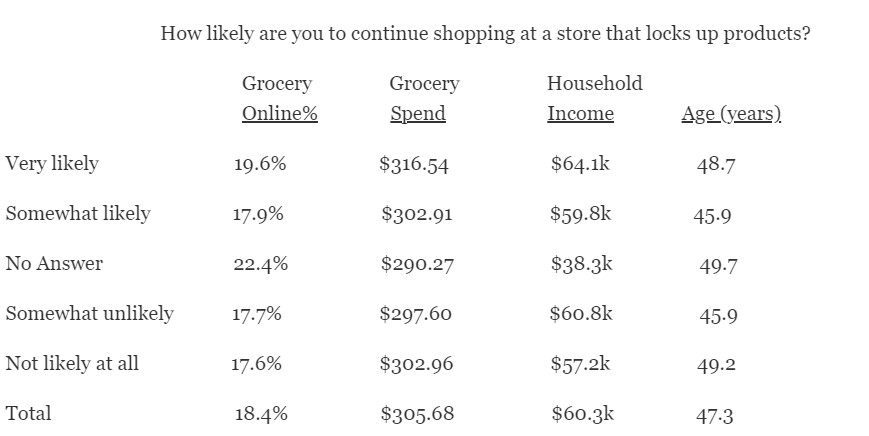
Table 5 shows a comparison of continuing shopping plans by several characteristics. The percent shopping online is for groceries only (all products later). The highest percentage is among those who say they are very likely to continue shopping at nearly 20%. The same group reports the highest average monthly grocery spend at $317, compared to $307 monthly for all adults. The group also reports the highest annual income at $64,100. An implication may be that those who shop more are more tolerant of locked-up items.
Table 5.

Contactless Checkout and Payment
A related issue is the acceptance of contactless in-store activities such as checkout and payment. Table 6 shows the preference for contactless in-store activities by generation. Preference for both contactless checkout and payment drop among older generations, that is Gen. X through Boomers, as shown in Table 6. Contactless preference is highest among Gen Z and Millennials.
Table 6.

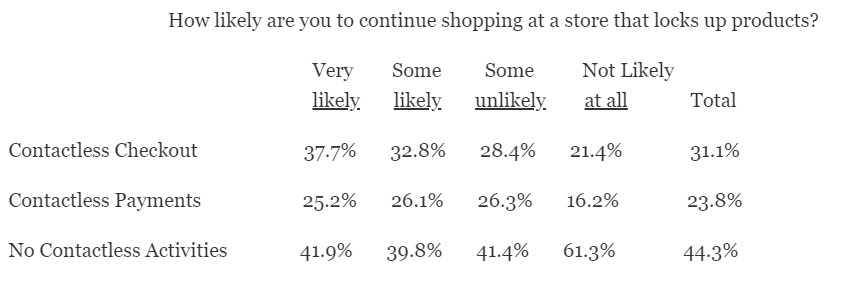
Table 7 compares preference for contactless activities and the likelihood of continuing shopping at a store with locked-up items. Preference for contactless checkout is highest among those who report being likely to continue shopping at the same store. Those who prefer no contactless activities are highest among those who say they are not likely to continue shopping at the same store.
Table 7.

Online Shopping
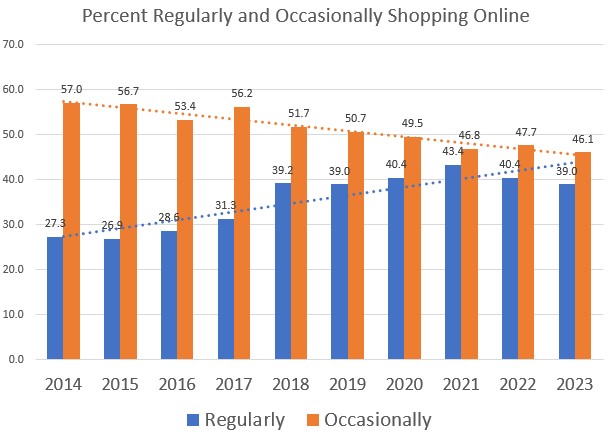
The total percentage of shopping online has changed only slightly in the last ten years. The overall rate of online shopping is 85.1% in 2023, with an annual growth rate of 0.5%. The biggest change has been a shift from occasional shopping to regular shopping, as shown in the figure below. The shift is approximately 10%. The implication is that those who want to purchase the locked-up product would be increasing the amount of online shopping.
In conclusion, the presence of locked-up items in retail stores significantly impacts consumer behavior. While a substantial portion of consumers still purchase locked-up items, many opt to shop elsewhere or online. Generational differences, preferences for contactless activities, and online shopping trends contribute to the complex dynamics of consumer responses to locked-up items in retail stores.

