Executive Summary
St. Patrick’s Day holds its place as a widely celebrated cultural moment in the U.S., with participation and spending showing steady consistency. The latest Prosper Insights & Analytics survey, conducted in February 2026, offers a snapshot of how Americans plan to mark the occasion this year.
An estimated 60.4% of adults plan to celebrate St. Patrick’s Day in 2026, placing it between Halloween and Valentine’s Day in terms of participation.
- Celebration rates have gone up slightly over the past decade, recovering from a decline in 2021 likely tied to COVID-19 and remaining relatively stable in recent years.
- Wearing green is the most common activity (78.5%), followed by preparing a special dinner, attending gatherings at bars or restaurants, and decorating homes or offices.
- Spending continues to center on food and beverages, with most purchases expected to take place at grocery and discount stores, consistent with prior years.
- Younger generations are more likely to celebrate with Gen Z, Millennials, and Gen X, reporting a 66.9% participation rate compared with 44.8% among Boomers and Seniors.
- Average planned spending has risen to $50.80 in 2026, up from $48.04 in 2025, reflecting gradual year-over-year growth.
Taken together, the findings suggest that St. Patrick’s Day continues to function less as a heritage-driven holiday and more as a social and seasonal retail occasion, anchored in shared traditions and everyday consumption habits.
Green, Gatherings, and Grocery Spend: St. Patrick’s Day Trends
By Dr. Martin Block, Professor Emeritus, Northwestern University, Retail Analytics Council
St. Patrick’s Day has become a popular American holiday. St. Patrick’s Day is among the topics covered by Prosper Insights & Analytics, which conducts monthly online surveys that collect data about annual events and related market behavior. St. Patrick’s Day celebration was asked in the February 2026 survey (n=7,901). In response to the question, “Will you celebrate St. Patrick’s Day this year, 60.4% of all adults said yes. As shown in Table 1, St. Patrick’s Day ranks between Halloween and Valentine’s Day. Participation rate is down slightly from 2025.
Table 1: Seasonal Holiday Participation
| Month | Holiday | Percent |
| January | Super Bowl | 79.9 |
| February | Valentine’s Day | 54.6 |
| March | St. Patrick’s Day | 60.4 |
| April | Easter | 80.7 |
| May | Mother’s Day | 84.2 |
| June | Father’s Day | 75.4 |
| Graduation | 33.6 | |
| July | 4th of July | 87.2 |
| August/September | Back to School | 40.1 |
| October | Halloween | 72.4 |
| November | Thanksgiving Shopping | 74.3 |
| December | Winter Holidays | 92.8 |
| Christmas | 85.3 |
Recent St. Patrick’s Day History
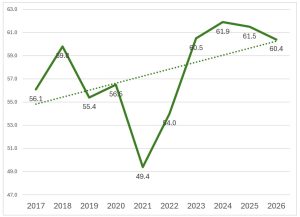
The rate of anticipated celebration of St. Patrick’s Day has increased slightly over the past ten years, as shown in Figure 1. The rate dropped in 2021, no doubt related to COVID-19, and has increased steadily since. In 2026, the rate dropped slightly but has remained relatively consistent over the last four years.
Figure 1: St. Patrick’s Day Celebration Trends
Plans for celebrating St. Patrick’s Day are shown in Table 2. Wearing green is the leading activity, followed by dinners, social activities, and parties. Decorating a home or office is reported by 1 in 4, with attending a parade well down the list. These are almost identical to the planned activities reported in 2025.
Table 2: Celebration Plans
| Percent | |
| Wear green | 78.5 |
| Make a special dinner | 25.7 |
| Attend a party at a bar/restaurant | 25.4 |
| Decorate home or office | 23.9 |
| Attend a private party | 17.7 |
| Attend a parade | 15.0 |
| Host a party | 14.9 |
The reasons to celebrate are shown in Table 3. After tradition, the most mentioned reason is that it is a social activity. Only about 1 in 4 say it is part of their Irish heritage.
Table 3: Reasons to Celebrate
| Percent | |
| It’s a fun tradition | 72.6 |
| It’s a social thing to do with friends | 41.6 |
| I like the food | 33.5 |
| It’s part of my Irish heritage | 24.9 |
| It’s my favorite holiday | 6.4 |
Food and beverage dominate spending plans among those celebrating St. Patrick’s Day, as shown in Table 4. Apparel, accessories and decorations are second to edibles. Interestingly, food and beverage are up slightly from 2025. Greeting cards and gifts are relatively unimportant compared to other holidays.
Table 4: Planned St. Patrick’s Day Spending
| Percent | |
| Food | 53.5 |
| Beverages | 44.5 |
| Apparel or accessories | 28.0 |
| Decorations | 25.5 |
| Candy | 17.6 |
| Greeting cards | 8.0 |
| Gifts | 6.2 |
As shown in Table 5, most of the planned spending will be in a grocery or discount store. Again, almost identical to 2025.
Table 5: Where Will St. Patrick’s Day Spend Occur
| Percent | |
| Grocery Store | 38.7 |
| Discount Store | 26.4 |
| Bar/Restaurant | 21.8 |
| Department Store | 19.9 |
| Online | 16.0 |
| Local/Small Business | 11.8 |
| Specialty Store (Greeting Card/Gift Store, Electronics Store) | 10.0 |
| Specialty Clothing Store | 9.2 |
| Drug Store | 6.2 |
| Catalog | 1.3 |
St. Patrick’s Day Celebrators
A classification regression tree (CRT) is a reasonable way to determine some of the characteristics of the St. Patrick’s Day celebrator. Using the overall proportion of 60.4%, gender, generation, income, and the presence of children, the tree estimates the relative proportion. Figure 2 shows the first split by generation: Boomers and Seniors at 44.8%, and Gen Z, Millennials, and Gen X at 66.9%. Celebrating St. Patrick’s Day appears to be strongly related to generation. The variables explaining the tree are shown by their relative importance in Table 6. The importance is shown as the average proportion change, then with a percentage calculated by the top variable generation. Income and the presence of children are the next most important variables.
Table 6: Importance of Demographic Predictors of Celebrators
| Independent Variable | Importance | Normalized Importance |
| Generation | 0.023 | 100.0 |
| Children | 0.007 | 30.6 |
| Income | 0.006 | 24.5 |
| Gender | 0.001 | 3.8 |
Figure 2: St. Patrick’s Day Celebrators Segmentation Tree

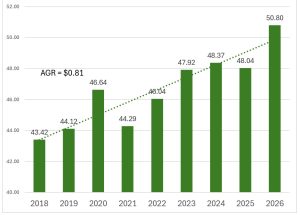
The planned spending has steadily increased, as shown in Figure 3. The 2026 average spend is $50.80, up from $48.04 in 2025. The average annual growth rate is $0.81. Celebrators are anticipating a $2.76 increase for essentially the same items over 2025.
Figure 3: Average Planned Spend
Respondents were asked if they planned any major purchases within the next six months, compared to those planning to celebrate St. Patrick’s Day, as shown in Table 7. An index is calculated by comparing the proportion of adults planning a purchase among those celebrating St. Patrick’s Day with the proportion of all adults. In every category, the celebrators out-plan the overall with an average index of 118.0. The highest indices are for a smartwatch (126.8) and stereo equipment (126.3). The closest is vacation travel with an index of 101.7, although the most planned spend is at 17.3%.
Table 7: Major Purchase Plans in Next 6 Months by Celebrating St. Patrick’s Day
| Celebrators | Total | Index | |
| Vacation Travel | 17.6 | 17.3 | 101.7 |
| Computer | 18.2 | 15.1 | 120.5 |
| Mobile Device | 14.8 | 12.5 | 118.4 |
| TV | 13.7 | 11.7 | 117.1 |
| Home Appliances | 13.1 | 11.0 | 119.1 |
| Furniture | 11.7 | 9.8 | 119.4 |
| Major Home Improvement or Repair | 9.6 | 8.2 | 117.1 |
| Smartwatch | 10.4 | 8.2 | 126.8 |
| Jewelry/Watch | 8.8 | 7.0 | 125.7 |
| House | 6.4 | 5.1 | 125.5 |
| Stereo Equipment | 4.8 | 3.8 | 126.3 |
| DVD/Blu-ray Player | 3.6 | 3.0 | 120.0 |
| RV/Boat | 3.1 | 2.5 | 124.0 |
| Digital Camera | 3.1 | 2.5 | 124.0 |
| Digital Voice Assistants (Amazon Echo | 2.7 | 2.3 | 117.4 |
| Average | 9.4 | 8.0 | 118.0 |
Summary
St. Patrick’s Day ranks between Halloween and Valentine’s Day in participation rate. Celebrating the day has increased over the last nine years. Spending is also up, although for essentially the same items as last year. Generation is the strongest predictor of planning to celebrate. Celebrators plan to buy more and shop more.