Super Bowl LIX From Tailgates to Retail Trends
By Dr. Martin Block, Professor Emeritus, Northwestern University, Retail Analytics Council
Executive Summary:
The Super Bowl continues to hold a significant place in American culture, rivaling major holidays such as Father’s Day and Halloween in terms of participation. The 2025 survey by Prosper Insights & Analytics highlights key trends, viewing habits, and spending patterns, showcasing the event’s cultural and economic impact.
- A higher percentage of adults plan to watch the Super Bowl in 2025 than in 2024, reaching 77.6%.
- Participation ranks alongside major holidays like Father’s Day and Halloween, surpassing only a few holidays, such as Christmas and Fourth of July.
- Key factors for Super Bowl enjoyment include the game itself, the half-time show, commercials, social gatherings, and fun food.
- Nearly half of people are not planning to throw or attend a Super Bowl party in 2025, reflecting a slight decrease from the previous year.
- Party spending continues to rise, with an average of $109.27 planned for 2025, most of which goes toward food and beverages.
- Super Bowl commercials are widely viewed as entertainment, though fewer people see them this way compared to 2024.
- More viewers report being influenced by purchasing products from Super Bowl advertisements than in the prior year.
- Viewing trends over the past nine years have been consistent, with the 2025 anticipation rate marking the highest since 2016.
- Social elements, like gathering with friends and preparing food, have gained more importance than the previous year.
- People who watch the Super Bowl generally report being happier than those who do not.
The Super Bowl isn’t just a game—it’s a tradition that brings people together through shared experiences, from the excitement of the game to the food, commercials, and halftime show. As more people plan to watch and celebrate in 2025, it’s clear the event continues to play a meaningful role in driving spending and consumer trends.
Super Bowl LIX From Tailgates to Retail Trends
By Dr. Martin Block, Professor Emeritus, Northwestern University, Retail Analytics Council
The Super Bowl has become a popular American pastime and part of the culture. Super Bowl watching is among the topics covered by Prosper Insights & Analytics, which conducts monthly online surveys that collect data about annual events and related market behavior. Super Bowl viewing was asked in the January 2025 survey (n=8,020). In response to the question, “When you watch the Super Bowl, what is the most important part for you?”, 22.4% said I don’t watch the Super Bowl. This leaves 77.6% of all adults who plan to watch it in 2025. This is up slightly from the 2024 estimate of 76.9%. As shown in Table 1, the Super Bowl ranks near the top based on last year’s participation, near Father’s Day and Halloween: only Christmas, Fourth of July, Mother’s Day, and Easter.
Table 1: Seasonal Holiday Participation
| Month | Holiday | Percent |
| January | Super Bowl | 77.6 |
| February | St. Patrick’s Day | 61.9 |
| Valentines Day | 52.0 | |
| Easter | Celebrate Easter | 80.7 |
| May | Mother’s Day | 84.2 |
| June | Father’s Day | 75.4 |
| Graduation | 33.6 | |
| July | 4th of July | 87.2 |
| Back to School | 40.1 | |
| August September | ||
| October | Halloween | 72.4 |
| November | Thanksgiving Shopping | 74.3 |
| December | Winter Holidays | 92.8 |
| Christmas | 85.3 |
Recent Super Bowl History
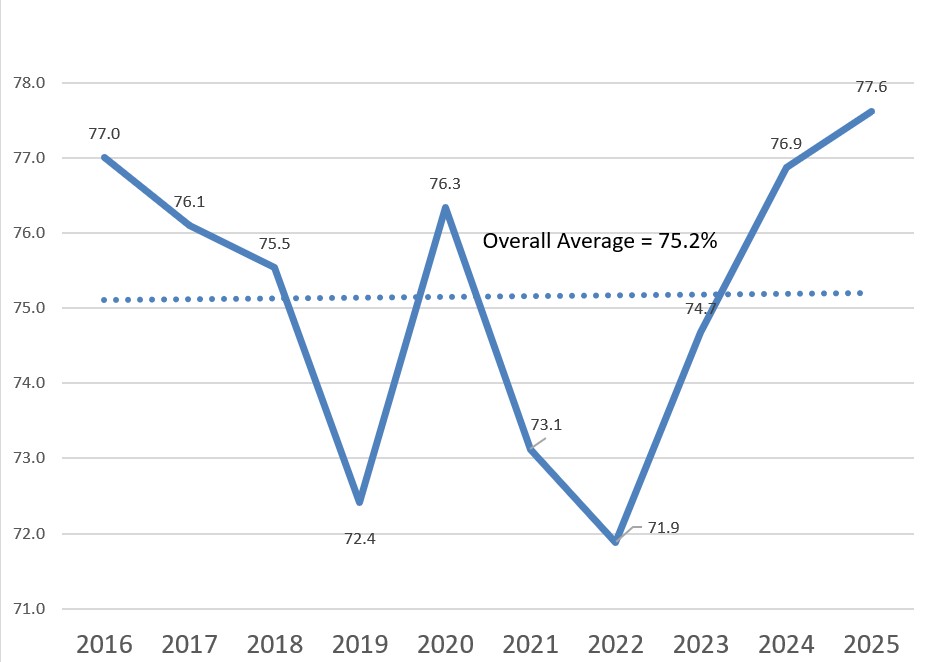
The rate of anticipated viewing of the Super Bowl has remained reasonably consistent over the past 9 years, as shown In Figure 1, with an overall average of 75.2%. Viewing trends are declining from 2016 to 2019, perhaps related to the political climate, then rebounding in 2020, to fall again in 2021 and 2022, no doubt related to Covid. The 2025 level is an all-time high at 77.6%, exceeding the previous high level of 2016.
Figure 1: Super Bowl Watching Trends
Considerations of the other important factors reported in 2024 and 2025 are shown in Table 2. The overall watching percentage has increased slightly from 2024. Most Super Bowl factors remained almost the same between 2024 and 2025. This is nearly the same as the game itself. Getting together with friends and fun food prepared for the game have increased slightly, perhaps indicating greater emphasis on the social aspects.
Table 2: Importance of Super Bowl Factors
| 2024 | 2025 | |
| The Game | 33.7 | 33.4 |
| The Half-Time Show | 14.6 | 14.9 |
| The Commercials | 13.8 | 13.5 |
| Getting together with friends | 9.9 | 10.4 |
| Fun food that is prepared for the game | 4.9 | 5.4 |
| Anticipate watching the game | 76.9 | 77.6 |
Super Bowl Parties
About half say they are not planning to throw or attend a party in 2025, as shown in Table 3. The numbers are almost the same as they were in 2024. Perhaps the biggest difference is the slight drop in the number of people not planning to attend or throw a party again, reflecting social involvement.
Table 3: Planning or Throwing a Super Bowl Party
| 2024 | 2025 | |
| No | 50.8 | 49.9 |
| Yes, I plan to attend a party | 25.6 | 25.9 |
| Yes, I plan to throw a party | 17.4 | 17.4 |
| Plan to watch at a bar/restaurant | 6.2 | 6.7 |
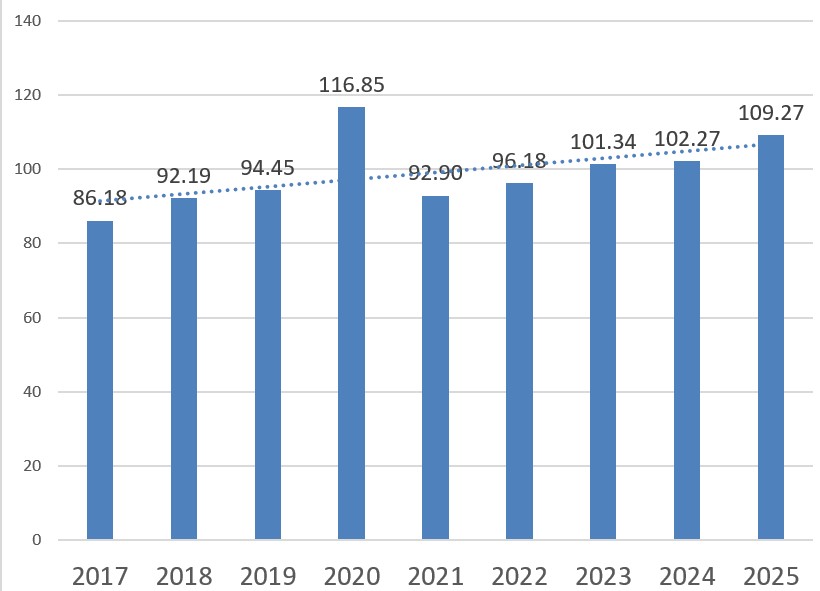
Planned spending has steadily increased, as shown in Figure 2. The 2025 average spend for those planning a party is $109.27, with an average annual growth rate of $1.93. The 2025 planned spend is 6.8% higher than 2024.
Figure 2: Average Planned Spend
As shown in Table 4, the overwhelming amount of party spending (81.2%) is on food and beverages. This is followed by team apparel at 13.8% and decorations at 8.4%.
Table 4: Party Spending Categories
| Percent | |
| Food/Beverages | 81.2 |
| Team apparel or accessories (hats, coats, etc.) | 13.8 |
| Television | 9.8 |
| Decorations | 8.4 |
| Furniture (including entertainment centers) | 6.1 |
Super Bowl Commercials
As indicated in Table 2, the relative importance of Super Bowl commercials has remained almost the same from 2024 to 2025. Table 5 shows a decline in the entertainment value of Super Bowl commercials, although the proportion is still high at 69.8%. Interestingly, the proportion that says “advertisers should save their money” but at the same time “they influence me to buy products from the advertisers” is increasing slightly.
Table 5: Super Bowl Commercials
| 2024 | 2025 | |
| I look at them as entertainment | 71.1 | 69.8 |
| They make me aware of advertiser brands | 19.6 | 19.6 |
| Advertisers should save their money and pass the savings on | 16.9 | 17.7 |
| They influence me to buy products from advertisers | 13.4 | 14.5 |
| They influence me to search online for more information | 13.1 | 12.8 |
| They make the game last too long | 9.1 | 8.3 |
| They bother me | 6.8 | 6.4 |
Summary
The Super Bowl has become a cultural event that ranks with Father’s Day and Halloween. Planning to watch the Super Bowl has increased slightly in 2025. As in past years, the game is less than half the importance to the viewer, with parties, commercials, and the halftime show accounting for the rest. Gender, age, and income are the strongest predictors of planning to watch. Watchers also plan to buy more big-ticket things and have bought more in all categories than those who do not watch. Super Bowl watchers are also happier than those who don’t plan to watch.