Executive Summary:
Valentine’s Day has long been associated with romance, but recent trends suggest that its focus and participation are shifting. Fewer people celebrate with romantic partners; instead, more include family, friends, and even pets. Economic factors, shifting consumer behaviors, and other shifts reshape how Americans observe Valentine’s Day.
- Valentine’s Day celebration rates have decreased by 0.37 percentage points per year over the past 13 years, with an overall average participation rate of 54.5%. However, 2025 shows a slight increase from 2024.
- While 51.6% of celebrators say the holiday is important to their significant other, 43.3% now celebrate with family and friends, highlighting a move toward a more inclusive holiday.
- The highest spending remains on significant others ($118.70 per person), but 31.9% buy for pets, spending an average of $37.29. Purchases for co-workers are declining (19.3% participation, -1.29% annual growth rate).
- Rising prices influence consumer choices, with 73.4% of consumers expecting higher costs—especially for flowers (75.9%) and candy (71.9%). As a result, 54.8% plan to take advantage of sales, while 24.6% are cutting back in other areas.
- Candy (56.3% participation, $30.62 avg. spend) remains the most popular gift, followed by flowers (40.5%, $49.25 avg. spend) and greeting cards (39.9%, $23.78 avg. spend, but declining). Though purchased by fewer people (21.9%), jewelry has the highest average spend at $202.61.
Valentine’s Day Evolves with Fewer Romantic Celebrations, More Family-Centered Traditions
By Dr. Martin Block, Professor Emeritus, Northwestern University, Retail Analytics Council
Valentine’s Day has become a popular American seasonal holiday and part of the culture. Valentine’s Day celebration is among the topics covered by Prosper Insights & Analytics, which conducts monthly online surveys to collect data about annual events and related market behavior. Celebrate Valentine’s Day asked in the January 2025 survey (n=8,020). In response to the question, 55.5% reported that they had answered yes.
Table 1: Seasonal Holiday Participation
| Month | Holiday | Percent |
| January | Super Bowl | 77.6 |
| February | St. Patrick’s Day | 61.9 |
| Valentines Day | 55.5 | |
| Easter | Celebrate Easter | 80.7 |
| May | Mother’s Day | 84.2 |
| June | Father’s Day | 75.4 |
| Graduation | 33.6 | |
| July | 4th of July | 87.2 |
| Back to School | 40.1 | |
| August September | ||
| October | Halloween | 72.4 |
| November | Thanksgiving Shopping | 74.3 |
| December | Winter Holidays | 92.8 |
| Christmas | 85.3 |
Recent Valentine’s Day History
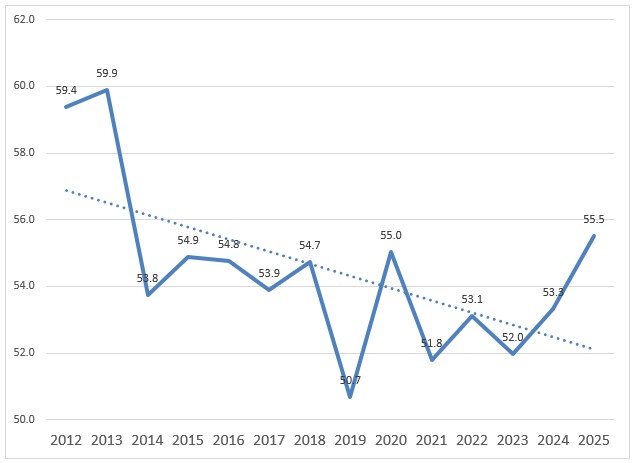
Overall, the anticipated rate of celebrating Valentine’s Day has decreased by .37 percentage points per year over the last 13 years, as shown in Figure 1, with an overall average of 54.5%. The current year, 2025, has a slight increase from 2024.
Figure 1: Celebrating Valentine’s Day
Valentine’s Day Planning
The most important reason for celebrating Valentine’s Day is the significant other or partner, as shown in Table 2. This is followed by a fun thing to do. Interestingly, 10.4% say that “It is expected of me.”
Table 2: Reasons to Celebrate Valentine’s Day
| Percent | |
| It’s important to my significant other / partner | 51.6 |
| It’s a fun thing to do with friends and family | 43.3 |
| Valentine’s Day is one of my favorite holidays | 20.0 |
| It’s expected of me | 10.4 |
About two out of three (68.3%) say they start planning in February, as shown in Table 3. The remainder plans in January or earlier.
Table 3: When Do You Start Planning
| Percent | |
| December or earlier | 3.8 |
| January | 27.9 |
| The first week of February / the week before Valentine’s Day | 42.2 |
| The week of Valentine’s Day | 20.5 |
| On Valentine’s Day | 5.6 |
The leading purchase location is online, as shown in Table 4. It is noteworthy that some respondents indicate more than one location.
Table 4: Where Will You Purchase
| Percent | |
| Online | 38.2 |
| Department Store | 33.9 |
| Discount Store | 28.8 |
| Florist | 18.1 |
| Specialty Store (Greeting Card/Gift Store, Electronics Store) | 18.0 |
| Local/Small Business | 17.0 |
| Jewelry Store | 12.8 |
| Specialty Clothing Store | 11.0 |
| Catalog | 1.7 |
| Other | 8.3 |
Most celebrators expect higher prices for their Valentine’s Day purchases, as shown in Table 5. This is especially true for traditional items, such as flowers and candy.
Table 5: Expect Higher Prices
| Percent | |
| Very likely | 35.2 |
| Somewhat likely | 38.2 |
| Unsure | 21.6 |
| Not very likely | 3.7 |
| Not likely at all | 1.2 |
| Items Expect Higher Prices | |
| Flowers | 75.9 |
| Candy | 71.9 |
| Clothing | 52.5 |
| Greeting cards | 48.7 |
| Other | 6.4 |
Most say they will take advantage of sales and promotions because of higher prices, as shown in Table 6. It is worth noting that nearly one-fourth say they will be buying gifts for fewer people. Only 7.8% say they will be spending less, compared to 25.2% saying they will spend more.
Table 6: Plans to Offset Higher Prices
| Percent | |
| Take advantage of sales and promotions | 54.8 |
| Cutting back in other areas | 24.6 |
| Buying gifts for fewer people | 23.4 |
| Prepare a meal at home instead of going out to eat | 22.8 |
| Use apparel I already own instead of opting for something new | 18.3 |
| Reuse last year’s decorations | 12.6 |
| Using Buy Now, Pay Later | 10.6 |
| Not buying gifts | 7.9 |
Celebrator Characteristics
Celebrators vary by gender, marital status, age, children in the household, and income. A classification regression tree (CRT) shows that marital status is the most important discriminating variable. The importance of independent variables is shown in Table 7. The presence of children is the second most important.
Figures 2a and 2b show the trees, first for singles and then for married. Married people are more likely to celebrate than younger persons on both sides of the tree. Income is also a predictor.
Figure 2a: Singles
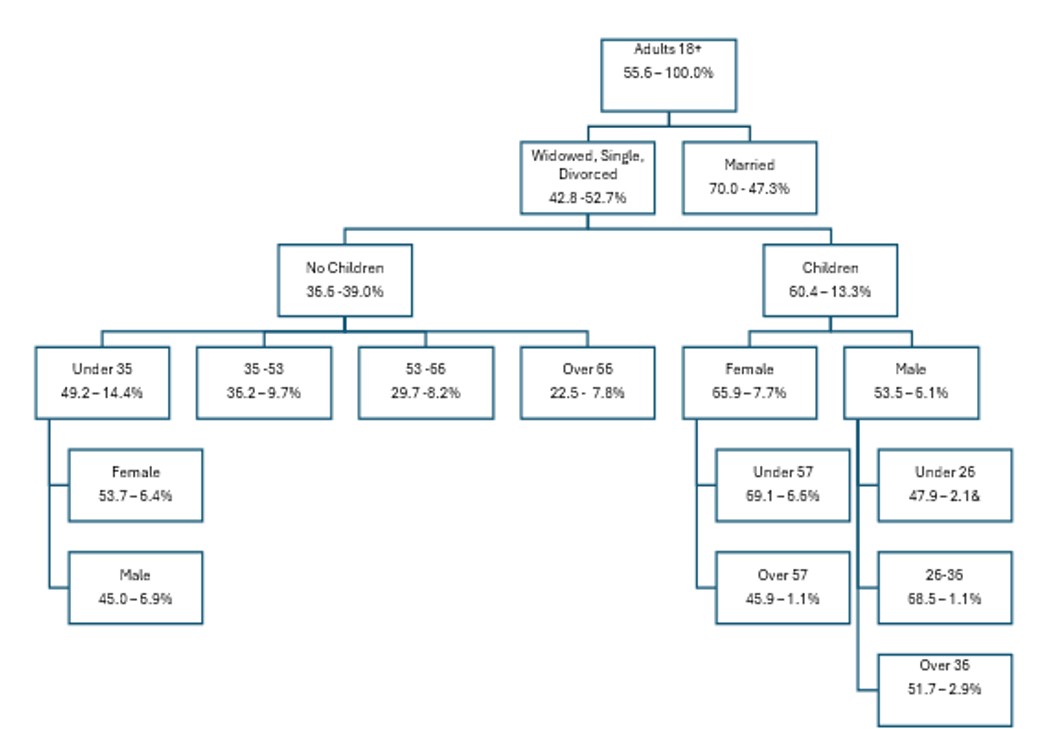
Figure 2b: Married
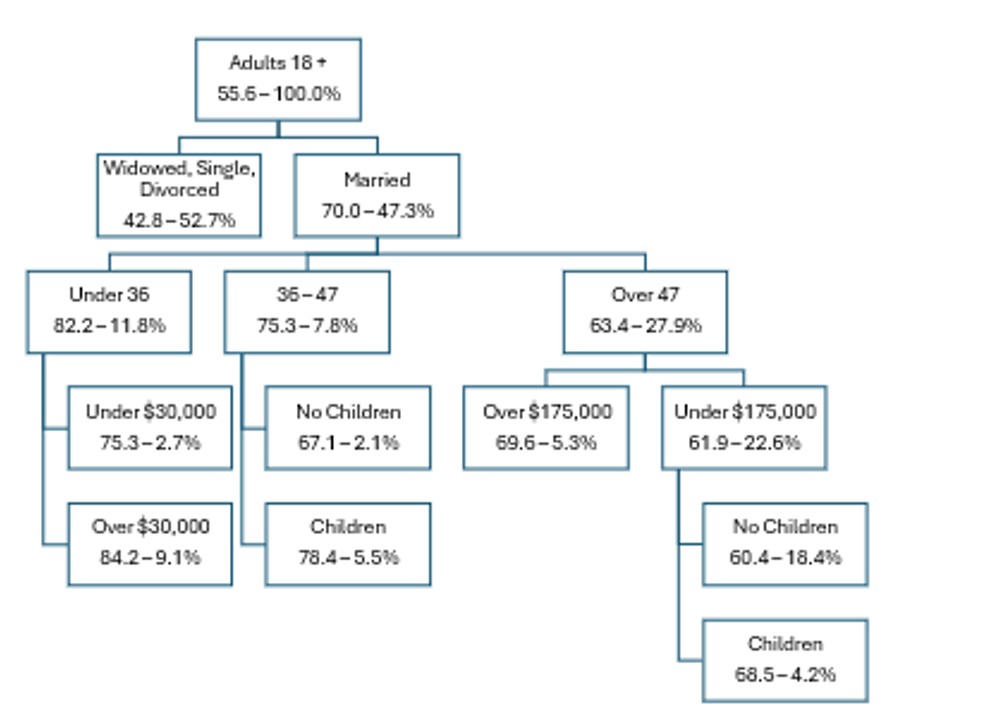
Table 7: Variable Importance
| Independent Variable | Importance | Normalized Importance |
| Marital Status | 0.043 | 100.00% |
| Children | 0.036 | 85.60% |
| Age | 0.021 | 48.70% |
| Income | 0.015 | 35.10% |
| Gender | 0.002 | 4.20% |
Spending by Person
Table 8 shows the planned spending by person, including significant other, other family, friends, children’s classmates or teacher, co-workers, pets and others. Overwhelmingly, the significant other is the person for whom Valentine’s Day gifts are purchased. It is also the leading spending amount with an average of $118.70 and the fastest amount growing at $3.26 per year over the last 11 years. Just uber a third (31.9%) buy for a pet and spend $37.29. Co-workers interestingly are purchased for by 19.3% and are declining.
Table 8: Planned Spend by Person
| Significant Other/
Spouse |
Other Family Members | Friends | Children’s Classmates/
Teachers |
Co-workers | Pets | Other | |
| Percent buying for | 84.5 | 58.2 | 32.2 | 25.7 | 19.3 | 31.9 | 13.4 |
| Average Spend Among Buyers | 118.70 | 51.27 | 45.40 | 50.26 | 54.27 | 37.29 | 65.09 |
| Annual Growth Rate
(11 years) |
3.26 | 1.03 | 0.50 | 0.51 | -1.29 | 0.09 | -1.04 |
| AGR as Percent | 2.75 | 2.01 | 1.09 | 1.02 | -2.38 | 0.24 | -1.61 |
Spending by Item
Table 9 shows the planned gifts by item. Candy leads the way, followed by flowers and greeting cards. Candy and gift cards have increased over the last eleven years, while greeting cards have decreased. The most expensive item is jewelry, priced at an average of $202.61, according to a reported 21.9%. Clothing and an evening out are also high on the expensive list.
Table 9: Planned Gifts
| Percent | AGR | Amount | |
| Candy | 56.3 | 0.56 | 30.62 |
| Flowers | 40.5 | 0.18 | 49.25 |
| Greeting Cards | 39.9 | -1.17 | 23.78 |
| An evening out | 35.2 | -0.45 | 106.22 |
| Jewelry | 21.9 | 0.20 | 202.61 |
| Clothing | 20.7 | 0.50 | 106.59 |
| Gift card/gift certificate | 20.6 | 0.60 | 87.02 |
| Other | 8.0 | -0.11 |
Summary
Valentine’s Day participation gradually declined over the last decade, averaging a decrease of 0.37 percentage points annually. While 2025 shows a slight increase from 2024, the holiday’s focus is evolving, becoming less focused on romantic relationships and more about celebrating with family and friends. Spending remains primarily focused on significant others, but purchases for other family members and even pets are notable. Rising costs influence consumer behavior, with many celebrators seeking sales and promotions or adjusting their spending habits. Traditional gifts like candy, gift cards, and clothing are growing in popularity, while the purchase of greeting cards is declining. The data suggests that Valentine’s Day is shifting from an exclusively romantic holiday to a broader family-oriented celebration.