Executive Summary:
Based on April 2025 data from Prosper Insights & Analytics, and in cooperation with the National Retail Federation (NRF), we present planned Mother’s Day activities.
Mother’s Day continues to hold a strong position in American consumer behavior and retail spending, despite shifts in economic conditions and gift preferences. Key findings from the 2025 survey (n=7,948) include:
- 83% of U.S. adults celebrate Mother’s Day, making it the third most popular holiday after Christmas (93.4%) and July 4th (87.2%).
- Total estimated spending for Mother’s Day 2025 is $34.1 billion, a 1.8% increase over 2024. Average spending per celebrator is $259.04.
- Spending on physical gifts like jewelry and electronics is down, while experiences and gift cards have seen increases—gift card spending rose 7.3%, and outings like brunch or dinner rose 4.8%.
- Shopping behavior is shifting online and toward small businesses: 35.9% of consumers plan to shop online (up 1.4%), and 24.8% at local/small businesses.
- Celebrators are more likely to be male, married, have children, and fall into younger age groups (Gen-Z and Millennials). Non-celebrators skew older and rural.
Despite inflation and price concerns, the tradition of Mother’s Day remains resilient, with most consumers prioritizing meaningful, unique experiences over lower costs.
What Moms (and Shoppers) Want in 2025
By Dr. Martin Block, Professor Emeritus, Northwestern University, Retail Analytics Council
Based on April 2025 data from Mother’s Day (Sunday, May 11, 2025) is the third most popular American holiday. Celebrating Mother’s Day is among the topics covered by Prosper Insights & Analytics (www.ProsperInsights.com) in the monthly online surveys that collect data about annual events and related market behavior. Celebrating Mother’s Day was asked in the April 2025 survey (n=7,948). In response to the question, “Do you expect to spend more, the same or less for Mother’s Day than you spent last year?” Of the total, 16.2% said they don’t celebrate Mother’s Day, leaving 83.8% that do. As shown in Table 1, Mother’s Day ranks between the 4th of July and Easter in popularity.
Table 1: Seasonal Holiday Participation
| Percent | |
| Christmas | 93.4 |
| 4th of July | 87.2 |
| Mother’s Day | 83.8 |
| Celebrate Easter | 80.7 |
| Super Bowl | 76.9 |
| Father’s Day | 75.3 |
| Halloween | 73.1 |
| St. Patrick’s Day | 61.9 |
| Valentines Day | 52.0 |
Recent Mother’s Day Celebration History
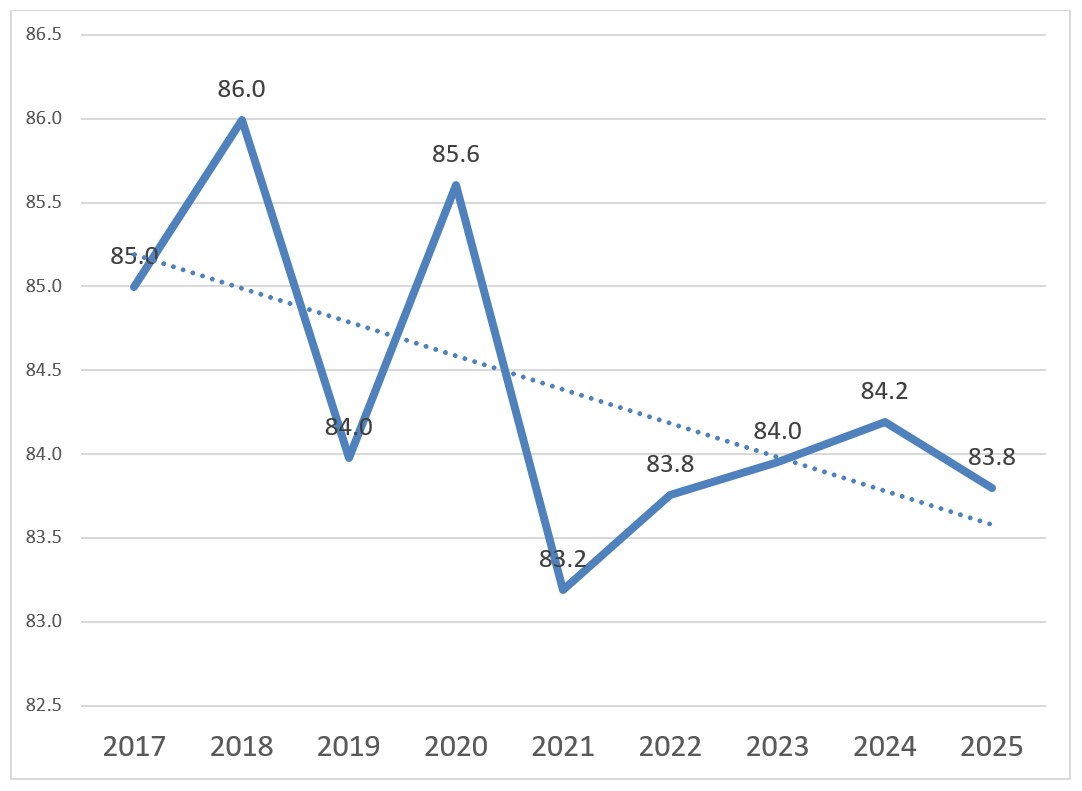
The Mother’s Day celebration rate has decreased slightly over the past eight years, as shown in Figure 1. The rate dropped sharply in 2021 because of COVID-19, and has a slight decrease of -0.20% per year. The rate, however, has increased slightly since then and has now decreased slightly in 2025.
Figure 1: Celebrate Mother’s Day Trends
Celebrating Mother’s Day is more complicated because it can involve different people, and often, more than one person is celebrated as a mother. Among the 83.8% that say they celebrate Mother’s Day, the average number of recipients is 1.4. This includes 53.1% who cite only one recipient, 21.3% who say two, and 6.9% who say three or more. The number reporting three or more is down from 10.6% in 2024. Among those that celebrate, the overall average spending of $259.04 is reported. This represents a 2.0% increase over 2024 and represents 34.1 billion dollars. Table 2 shows that by far the most common recipient is a mother or stepmother, at 61.6%. This is followed by a wife at 21.3%. Celebrating other people, such as a daughter, a sister, or a grandmother, implies more recipients. A grandmother, for instance, is celebrated by 8,5% but is one of 2.6 others.
Table 2: Mother’s Day People Celebrated
| Number of | ||
| Percent | Recipients | |
| Mother or Stepmother | 61.6 | 1.5 |
| Wife | 21.3 | 1.9 |
| Daughter | 11.1 | 2.1 |
| Sister | 9.6 | 2.7 |
| Friend | 8.6 | 2.6 |
| Other relative | 7.2 | 2.0 |
| Grandmother | 8.5 | 2.6 |
| Godmother | 2.6 | 3.3 |
Flowers and greeting cards are the most common items purchased as shown in Table 3. The categories are ranked by how often they are purchased. Special outings beyond dinner or brunch can include tickets to a concert or sporting event, hot air balloon ride, gym membership, spa service, art or learning classes, etc. All categories, except greeting cards, have increased over the last eight years, while flowers have decreased since 2023. The approach to spending in 2024 favors spending on experiences rather than on physical gifts. This is reflected in the changes in spending. The sharpest year-over-year percentage decreases are in physical items such as clothing, jewelry, housewares and gardening tools.
Table 3: Planned Mother’s Day Buying
| Percent Buying | 2024 | 2025 | Year over Year |
| Flowers | 74.3 | 73.8 | -0.7 |
| Greeting card(s) | 73.7 | 72.6 | -1.5 |
| Special outing, such as dinner or brunch | 59.3 | 60.6 | 2.2 |
| Gift Card(s)/Certificate(s) | 51.3 | 53.0 | 3.3 |
| Clothing or clothing accessories | 43.8 | 47.7 | 8.9 |
| Jewelry | 40.3 | 41.9 | 4.0 |
| Personal Service, such as day at a spa, or a massage | 31.5 | 33.5 | 6.3 |
| Housewares or gardening tools | 27.1 | 28.7 | 5.9 |
| Books or CDs | 23.6 | 25.6 | 8.5 |
| Consumer electronics or computer-related accessories | 21.0 | 22.1 | 5.2 |
| Other | 27.3 | 28.2 | 3.3 |
As shown in Table 4, the amount planned to spend is less in every physical gift category compared to last year, except gift cards and special outings. The drop from last year no doubt reflects the current economy. Jewelry is the highest spending item, with a decline of 7.0%. The biggest decline is in consumer electronics.
Table 4: Planned Mother’s Day Spend Amounts
| Buyer Spend | 2024 | 2025 | Year over Year |
| Jewelry | 131.90 | 122.68 | -7.0 |
| Consumer electronics or computer-related accessories | 126.78 | 110.48 | -12.9 |
| Special outing, such as dinner or brunch | 75.85 | 79.48 | 4.8 |
| Personal Service, such as a day at a spa, a facial or a massage | 70.65 | 70.12 | -0.8 |
| Clothing or clothing accessories | 52.57 | 50.29 | -4.3 |
| Housewares or gardening tools | 49.90 | 48.51 | -2.8 |
| Gift Card(s)/Certificate(s) | 47.09 | 50.54 | 7.3 |
| Flowers | 32.18 | 32.56 | 1.2 |
| Books or CDs | 24.62 | 23.95 | -2.7 |
| Greeting card(s) | 11.06 | 11.01 | -0.5 |
| Other | 32.27 | 31.05 | -3.8 |
| Total Spend | 254.04 | 259.04 | 2.0 |
The overall impact on the economy, multiplying the spending, participation, and population size, provides an estimate of the total economic impact as shown in Table 5. Mother’s Day contributes $34.1 billion to the U.S. economy, which is up 1.8% from last year. Flowers, by themselves, contribute $3.2 billion, and greeting cards $1.1 billion.
Table 5: Estimated Economic Impact
| Billions | 2024 | 2025 | Year over Year |
| Jewelry | 7.0 | 6.8 | -2.9 |
| Special outing, such as dinner or brunch | 5.9 | 6.3 | 6.8 |
| Consumer electronics or computer-related accessories | 3.5 | 3.2 | -8.6 |
| Gift Card(s)/Certificate(s) | 3.2 | 3.5 | 9.4 |
| Flowers | 3.2 | 3.2 | 0.0 |
| Clothing or clothing accessories | 3.0 | 3.2 | 6.7 |
| Personal Service, such as a day at a spa, a facial, or a massage | 2.9 | 3.1 | 6.9 |
| Housewares or gardening tools | 1.8 | 1.8 | 0.0 |
| Greeting card(s) | 1.1 | 1.1 | 0.0 |
| Books or CDs | 0.8 | 0.8 | 0.0 |
| Total | 33.5 | 34.1 | 1.8 |
Where celebrators are spending their money is also changing. Table 6 shows that online is the leading source for gift purchases, with nearly 36%. Online and especially local or small businesses have both increased over the last year. Specialty clothing stores and department stores are both decreasing.
Table 6: Retail Outlets
| Year over | |||
| 2024 | 2025 | Year | |
| Online | 35.4 | 35.9 | 1.4 |
| Department Store | 32.3 | 31.6 | -2.2 |
| Specialty Store (Greeting Card, Florist, Jeweler, Electronics ) | 28.6 | 28.6 | 0.0 |
| Local/Small Business | 25.5 | 24.8 | -2.7 |
| Discount Store | 22.5 | 22.3 | -0.9 |
| Specialty Clothing Store | 12.4 | 12.1 | -2.4 |
| Catalog | 2.0 | 2.0 | 0.0 |
Over two-thirds of consumers say they look to the retailer for gift inspiration, as shown in Table 7. This represents a substantial opportunity for the retailer, with 33.9% doing so always or very often.
Table 7: Look to Retailers for Gift Inspiration
| Percent | |
| Always | 12.5 |
| Very often | 21.4 |
| Sometimes | 34.3 |
| Not very often | 15.8 |
| Never | 16.0 |
What is important to celebrators in purchasing Mother’s Day gifts is shown in Table 8. The leading reason, at 48%, is finding a gift that is unique or different. This was followed by finding a gift that creates a special memory at 42%. Convenience and cost-effectiveness are much lower on the list.
Table 8: Importance in Gift Purchasing
| Percent | |
| Finding a gift that’s convenient for me | 24.3 |
| Finding a gift that’s unique or different | 47.8 |
| Finding a gift that’s cheaper or more cost-effective | 18.9 |
| Finding a gift that creates a special memory | 41.8 |
| Other | 6.9 |
Jewelry, flowers and consumer electronics are all seen as items that will be more expensive because of tariffs as shown in Table 9. % don’t anticipate gifts being any more expensive.
Table 9: Gifts that will be More Expensive
| Percent | |
| Jewelry | 39.2 |
| Flowers | 34.0 |
| Books or CDs | 16.6 |
| Greeting cards | 21.3 |
| Consumer electronics or computer-related accessories | 40.9 |
| Housewares or gardening tools | 25.8 |
| Personal services (such as a day at the spa or a massage) | 24.8 |
| Special outing, such as dinner, or fun activity/experience | 33.3 |
| I don’t anticipate any gifts being more expensive this year | 22.2 |
The two most common ways of dealing with more expensive items are to take advantage of sales and promotions and buy less expensive items, as shown in Table 10. Small proportions report not planning to buy gifts or choosing not to travel for the holiday.
Table 10: Plans if More Expensive
| Percent | |
| Take advantage of sales and promotions | 41.4 |
| Cutting back on other areas | 18.6 |
| Buying gifts for fewer people | 12.2 |
| Prepare a meal at home instead of going out to eat | 20.9 |
| Not buying gifts | 12.9 |
| Using Buy Now, Pay Later | 9.6 |
| Buying less expensive gifts | 27.0 |
| Making a handmade gift | 13.4 |
| Choosing not to travel for the holiday | 9.4 |
As shown in Table 11, the economic uncertainty has little impact on celebrating Mother’s Day. Less than 10% say celebrating it is less important.
Table 11: Importance of Celebrating Mother’s Day
| Percent | |
| Much more important | 15.5 |
| Slightly more important | 14.3 |
| Same | 60.6 |
| Slightly less important | 5.4 |
| Much less important | 4.2 |
Mother’s Day Celebrators
Descriptions of who the Mother’s Day celebrators are are shown in Tables 12 and 13. The comparison is made according to the change in planned spend since last year. Most of the sample, 83.4%, plan to celebrate Mother’s Day, leaving 15.7% that don’t celebrate as noted earlier. To facilitate comparison, an index is computed comparing the percentage among those who celebrate to the total. As shown in Table 12, celebrators are more likely to be male, married and have children. Having children seems to be the most important predictor. Those who don’t celebrate are most likely to be divorced, separated, or widowed. Celebrators also have higher income.
African American, Asian, and Hispanic groups are more likely to celebrate Mother’s Day, as shown in Table 13. This is especially true among Hispanics, noting the very low index among those who don’t celebrate. Age is also an important characteristic, with the celebrators being highest among Gen-Z and Millennials. The average age among non-celebrators is nearly 60, compared to the total population of adults at 48. Non-celebrators are also more likely to live in rural areas.
Table 13: Celebrator Characteristics (Percents)
| Don’t | Celebrate | Total | Index | ||
| Female | 59.6 | 50.9 | 52.2 | 103.2 | |
| Married | 29.1 | 42.4 | 40.3 | 105.2 | |
| Living with Unmarried Partner | 5.9 | 8.7 | 8.2 | 106.1 | |
| Divorced or separated | 19.6 | 10.7 | 12.2 | 87.7 | |
| Widowed | 10.6 | 5.1 | 6.0 | 85.0 | |
| Single, never married | 34.8 | 33.1 | 33.3 | 99.4 | |
| Children | 13.8 | 36.8 | 33.2 | 110.9 | |
| Gen-Z | 6.6 | 22.1 | 19.6 | 112.8 | |
| Millennials | 14.9 | 26.8 | 24.9 | 107.6 | |
| Gen-X | 26.4 | 27.8 | 27.6 | 100.7 | |
| Boomers | 47.3 | 21.6 | 25.7 | 84.0 | |
| Seniors | 4.8 | 1.7 | 2.2 | 77.3 | |
| age | 58.6 | 46.4 | 48.3 | 96.1 | |
| income | 54.9 | 68.6 | 66.5 | 103.2 | |
| African American | 11.0 | 14.5 | 13.9 | 104.3 | |
| Asian | 3.8 | 5.4 | 5.1 | 105.9 | |
| Multi-Racial | 2.5 | 1.7 | 1.9 | 89.5 | |
| White | 71.0 | 59.9 | 61.6 | 97.2 | |
| Hispanic | 8.8 | 16.6 | 15.3 | 108.5 | |
| Rural | 25.9 | 22.7 | 23.2 | 97.8 | |
| Urban | 36.8 | 40.5 | 39.9 | 101.5 | |
| Suburban | 36.3 | 36.2 | 36.2 | 100.0 | |
Happiness
Respondents are asked to rate their overall happiness across ten categories on a five-point scale. Table 14 shows the proportion of consumers indicating they are either happy or totally happy. The unmistakable conclusion is that those who plan to celebrate Mother’s Day are happier than those who do not, as shown in the composite average. The biggest differences are in happiness with government, love life, work life, and government as was seen among previous Easter celebrators last month.
Table 14: Happiness by Mother’s Day Celebration (Percents)
| Don’t | Celebrate | Total | Index | |
| Overall | 47.0 | 55.6 | 54.3 | 102.5 |
| Government | 16.3 | 26.9 | 25.2 | 106.6 |
| Love life | 38.8 | 54.3 | 51.9 | 104.7 |
| Work | 32.9 | 44.7 | 42.9 | 104.3 |
| Health | 46.0 | 56.8 | 55.1 | 103.1 |
| Family | 55.7 | 66.9 | 65.1 | 102.7 |
| Religion | 51.5 | 58.5 | 57.4 | 101.9 |
| Home life | 57.3 | 65.1 | 63.8 | 101.9 |
| Friends | 57.9 | 62.6 | 61.9 | 101.2 |
| House | 57.3 | 60.8 | 60.3 | 100.9 |
| Neighborhood | 56.5 | 59.5 | 59.0 | 100.8 |
Summary
Mother’s Day ranks between the 4th of July and Easter in popularity. Celebrating the day has remained almost flat in the last eight years. Spending, however, is also down, especially for physical gifts. The presence of children, age, marital status and income are the strongest predictors of planning to celebrate. Celebrators are shopping more online and at local businesses. Mother’s Day celebrators are also happier than those who don’t plan to celebrate.