Executive Summary
The 2025 holiday season reflects a growing tension between enthusiasm and economic restraint. Data from the October 2025 Prosper Insights & Analytics survey, conducted in partnership with the National Retail Federation (NRF), shows that while 92.8% of adults plan to celebrate the winter holidays, shoppers are changing how and when they buy. Consumers are beginning their shopping earlier than ever, more than half by October, but delaying major purchases until promotions appear. With 55.2% reporting that the economy is affecting their spending plans, this year’s holiday shoppers are approaching the season strategically with patience and a clear focus on value.
- Holiday participation remains strong: 92.8% of adults plan to celebrate the winter holidays in 2025.
- Shopping starts early: Over half (51.9%) begin holiday shopping in October or earlier—8.4% before September, 7.9% in September, and 25.6% in October.
- Most will finish in December: Despite early starts, 60.3% say they will finish shopping in December, showing a long and staggered retail season.
- Deal-driven behavior dominates: The top reason for waiting to shop is finding the best prices and promotions (44.7%), followed by availability of items (34.2%) and tradition (33.2%).
- Economic pressures are widespread: 55.2% of consumers say the economy is affecting their holiday spending plans.
- Frugal strategies emerge, compared to previous years:
- 46.8% shop sales are more often.
- 35.4% compare prices online more often.
- 29.5% use coupons more frequently.
- Practicality replaces indulgence: 23.5% are buying more practical gifts or necessities as presents; 19.4% are traveling less or not at all.
- Budget-conscious creativity rises: 13.5% are making more gifts by hand, and 18.6% plan to reuse last year’s decorations.
Strategic Spending: Why Americans Start Shopping Early but Spend Less
By Dr. Martin Block, Professor Emeritus, Northwestern University, Retail Analytics Council
The winter holidays, notably Christmas, are the major retail event of the year and extend at least three months. The data is from Prosper Insights & Analytics in partnership with the National Retail Federation (NRF). Adults were asked about the winter holidays in the October 2025 Prosper survey (n=8,247). In response to the question, “Do you plan to celebrate any of the winter holidays this year? The percentages shown for Winter holidays in Table 1 include Christmas, Chanukah and Kwanza. Individually, Christmas is reported by 82.4%, Chanukkah by 8.2%, and Kwanza by 3.0%. Interestingly, 66.7% of those celebrating Chanukah also say they are celebrating Christmas, and 83.5% of Kwanza celebrators also celebrate Christmas.
Christmas has taken a secular turn. In January 2025, 59.8% reported identifying with a Christian religion (Catholic, Protestant, or Mormon), 3.6% with Jewish identity, 9.6% with other non-Christian religions, and 28.4% with no religious identity. These numbers indicate a large proportion who celebrate Christmas but do not identify with the Christian faith.
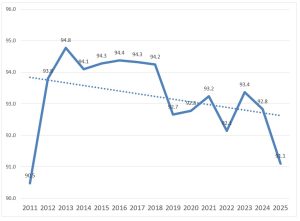
Overall, 92.8% of respondents reported planning to celebrate in October 2024. Figure 1 shows the trend for responses to this question since 2011. The 2025 results represent a small decrease from the prior average annual decrease of .04%. The celebration percentages are almost flat over the 15 years.
Table 1: Holidays by Month
| Month | Holiday | Percent |
| January | Super Bowl | 76.9 |
| February | St. Patrick’s Day | 61.9 |
| Valentines Day | 52.0 | |
| Easter | Celebrate Easter | 80.7 |
| May | Mother’s Day | 84.2 |
| June | Father’s Day | 75.4 |
| Graduation | 33.6 | |
| July | 4th of July | 87.2 |
| Back to School | 40.1 | |
| August September | ||
| October | Halloween | 72.4 |
| November | ||
| December | Winter Holidays | 91.1 |
| Christmas | 82.4 |
Figure 1: Winter Holiday Celebration Trends
Holiday Spending
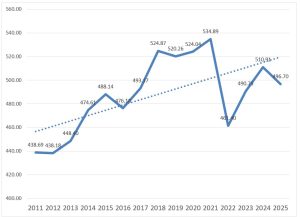
Planned spending on gifts for the family is shown in Figure 2. The planned spending increases over the 14 years, reaching $496 in 2025 among spenders. The pandemic year of 2022 saw a sharp drop. Spending on family gifts has not yet reached pre-pandemic levels. Spending on gifts for friends and co-workers, however, has steadily increased.
Figure 2: Gifts for Family Among Spenders
Spending on non-gift items such as decorations, candy and food, greeting cards, and flowers and plants all indicate increases through 2025.
Table 2 summarizes spending by category. The overall weighted total planned spending is $890.49, with gifts accounting for about two-thirds of the total. While spending on gifts for family has not increased at the same rate as other gift categories, it still makes up more than half of total spending. Table 2 shows the average spending levels among those who plan to spend. Table 3 shows that gifts for the family are increasing at the highest rate. Overall holiday spending of $890.49 is increasing at an annual rate of $10.78.
Table 2: Holiday Spending Comparison
| Percent Spending | Average $ Among
Spenders |
Percent of Total | |
| Gifts for Family | 94.7 | 496.70 | 55.9 |
| Gifts for Friends | 68.3 | 121.50 | 13.6 |
| Gifts for Co-Workers | 33.6 | 102.27 | 11.5 |
| Gifts Other | 43.3 | 92.39 | 4.2 |
| Decorations | 71.1 | 100.53 | 13.3 |
| Greeting Cards and Postage | 64.1 | 51.90 | 5.8 |
| Candy and Food | 91.4 | 138.08 | 15.5 |
| Flowers/Plants | 47.1 | 67.27 | 7.8 |
| Weighted Total | 890.49 | 100.0 |
Table 3 shows the relative annual growth across the categories. Over the past 14 years, gifts for the family have increased by an average of $0.52 per year. Decorations over the same time period have increased at an average rate of $2.20, and candy and food have increased by $2.33.
Table 3: Holiday Spending Growth
| Percent Spending | Average $ | AGR
$ |
|
| Gifts for Family | 94.7 | 496.70 | 4.51 |
| Gifts for Friends | 68.3 | 121.50 | 1.43 |
| Gifts for Co-workers | 33.6 | 102.27 | 2.27 |
| Gifts Other | 43.3 | 92.39 | 2.38 |
| Decorations | 71.1 | 100.53 | 2.08 |
| Greeting Cards and Postage | 64.1 | 51.90 | 1.07 |
| Candy and Food | 91.4 | 138.08 | 2.09 |
| Flowers/Plants | 47.1 | 67.27 | 1.68 |
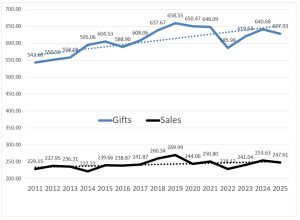
Figure 3 shows the difference between holiday gifts among spenders and those taking advantage of winter holiday sales. Both spending levels have remained relatively flat throughout the 11 years. The total for gifts among all adults, not just spenders, is $627.93 and $890.49 for all holiday items. The total for sales items, such as Black Friday, is $247.61 among planned spenders and $113.87 among all adults. Assuming 132 million households, this translates to planned holiday spending of $117.5 billion and planned sale spending of $15.0 billion.
Figure 3: Planned Gifts and Sales Among Spenders
Shopping Plans
Early October, when the survey was conducted, is perhaps an early indication of when holiday shopping may start. As shown in Table 4, well over half of adults say they will begin holiday shopping in October or earlier. Only about 13% say they will start in December. As Table 5 shows, 60% say they will finish in December.
Table 4: Start Shopping for the Holiday Season (Percent)
| Before September | 8.4 |
| September | 7.9 |
| October | 25.6 |
| November | 42.2 |
| First 2 weeks of December | 13.2 |
| Last 2 weeks of December | 2.7 |
Table 5: When to Finish Holiday Shopping (Percent)
| September or earlier | 3.7 |
| October | 8.4 |
| November | 27.6 |
| December | 60.3 |
The reasons for waiting to shop are shown in Table 6. The leading reason seems to be figuring out the best prices and promotions, around 45%. It is also interesting that only 25% are waiting to figure out what to buy. A third says it is a tradition.
Table 6: Reasons for Waiting
| Percent | |
| It’s when I find the best prices/promotions | 44.7 |
| It’s when I figure out what I am going to buy | 24.9 |
| It’s a tradition/when I always shop | 33.2 |
| It’s when the best holiday items are available | 34.2 |
| I don’t know what I will need to buy before November | 17.2 |
| I can’t afford to start shopping earlier | 17.7 |
Nearly three out of five say they would consider gently used, secondhand, or refurbished items as gifts, as shown in Table 7. At the top of the list are books, followed by clothing. The reasons why gently used items are considered, as shown in Table 8, are to save money and provide greater value. About one out of five say they find one-of-a-kind items.
Table 7: Consider Gently Used, Secondhand, or Refurbished Gifts
| Percent | |
| Books, CDs, DVDs, videos, or video games |
26.2 |
| Clothing or clothing accessories |
22.5 |
| Home décor or home-related furnishings |
18.4 |
| Consumer electronics or computer-related accessories |
16.6 |
| Jewelry or precious metal accessories |
15.3 |
| Sporting goods or leisure items |
13.9 |
| Toys |
12.5 |
| Home improvement items or tools |
13.4 |
| Personal care or beauty items |
7.8 |
| None of the above |
40.9 |
Table 8: Reasons for Gently Used Items
| Percent | |
| Save money | 46.4 |
| Greater value | 25.1 |
| Be more sustainable | 23.5 |
| Find one-of-a-kind items | 20.7 |
| Afford higher-end or luxury brands | 16.0 |
| Other | 0.7 |
| None of the above | 28.5 |
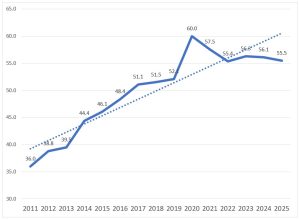
The percentage of those who say they plan to do holiday shopping online has steadily increased over the past 14 years, as shown in Figure 4. While the online shopping rate has hovered around 60% over the last five years, it has grown considerably over the prior years, at an average annual growth rate of 1.53%.
Figure 4: Percent Holiday Shopping Online
Just over half say that the economy is affecting their holiday spending plans, as shown in Table 9. The reported impacts are spending less overall and shopping sales more often. This may relate to the family gifts discussed earlier.
Table 9: Impact of the Economy on Holiday Behavior
| Percent | |
| Spending less overall | 55.2 |
| Shopping for sales more often | 46.8 |
| Comparative shopping online more often | 35.4 |
| Using coupons more often | 29.5 |
| Buying more practical gifts or necessities as gifts | 23.5 |
| Traveling less or not at all | 19.4 |
| Using last year’s decorations with no plans to buy new ones | 18.6 |
| Comparative shopping using my mobile phone more often | 17.3 |
| Making more gifts for family and friends | 13.5 |
| Comparative shopping with newspapers/circulars more often | 12.0 |
| Purchasing a joint gift instead of buying individual gifts | 7.5 |
| Using layaway | 7.4 |
| Using Buy Now, Pay Later payment option | 6.4 |
Summary
The 2025 Prosper Insights & Analytics holiday survey shows that while more than 92% of adults plan to celebrate the winter holidays, shoppers are approaching the season with caution. Over half begin buying by October, yet most wait for deals before finishing in December. With 55% saying the economy is affecting their plans, consumers are prioritizing value, practicality, and timing over impulse and excess.