Executive Summary:
As the back-to-school and college shopping season unfolds, new survey data sheds light on consumer spending trends and behaviors for 2024. This year, spending continues to be a significant retail event, driven by both necessity and seasonal shopping patterns.
• Average back-to-school spending is projected at $874 per family, while college spending averages $1,364.75.
• Electronics and clothing are the most significant expenses, with a noticeable rise in the purchase of laptops and tablets.
• Nearly 70% of shoppers report encountering higher prices this year, with clothing and school supplies being the most affected.
• A growing number of shoppers are considering gently used items to save money and find unique products.
• Over 16% of families plan to homeschool their children, resulting in higher expenditures on school supplies and electronics.
This article highlights a shift towards increased spending and cost-saving strategies amid rising prices. The growing trend of homeschooling further influences spending patterns, emphasizing the evolving landscape of educational shopping.
What Retailers Need to Know about Back-to-School and College Spending
By Dr. Martin Block, Professor Emeritus, Northwestern University, Retail Analytics Council
Back-to-school and college is a major retail event. Adults were asked in the July 2024 survey (n=7,533). In response to the question, “Do you plan to shop for back-to-school/college this year? year?” Back-to-school and college retail spending is a multi-month event beginning for some consumers as early as late June and running through September. As of early July, 45.3% say they have not started yet. Of those that have started, the average estimate of percent completed is 19.2%
Overall, 40.1% reported planning to shop for back-to-school or college. Of the total, 28.2% report shopping for back-to-school, while 25.9% report shopping for back-to-college. This leaves 14.1% that are shopping for both. Of those shopping for back-to-college, 14.3% say they are shopping for themselves, and 11.6% say they are shopping for a child. Historically, the percentage of people shopping for back-to-school has varied little in the last seven years. There was a 5% drop in 2021, no doubt due to the pandemic.
Table 1: Holidays by Month
| Month | Holiday | Percent |
| January | Super Bowl | 76.9 |
| February | St. Patrick’s Day | 61.9 |
| Valentines Day | 52.0 | |
| Easter | Celebrate Easter | 80.7 |
| May | Mother’s Day | 84.2 |
| June | Father’s Day | 75.4 |
| Graduation | 33.6 | |
| July | 4th of July | 87.2 |
| Back-to-school | 40.1 | |
| August September | ||
| October | Halloween* | 73.1 |
| November | Thanksgiving* | 73.9 |
| December | Christmas* | 93.4 |
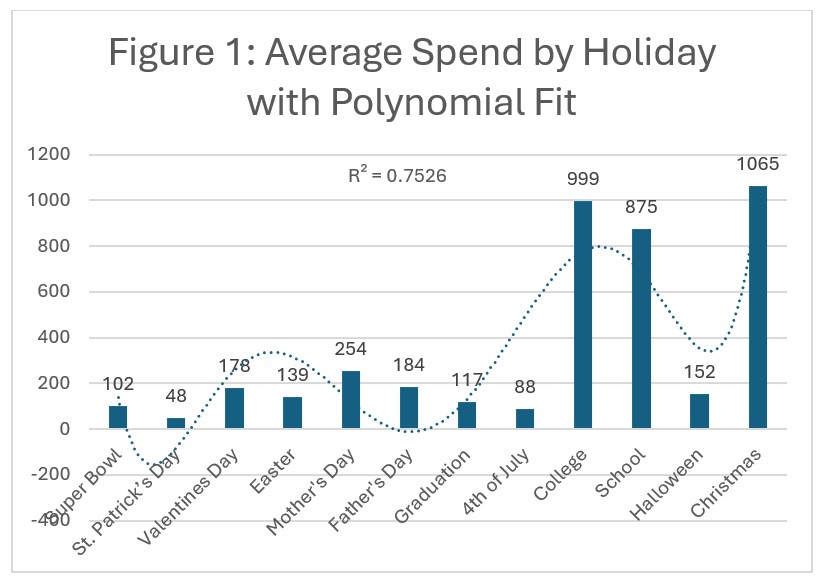
Back-to-school and college average spending far exceeds all other holidays except Christmas. Figure 1 shows the annual pattern of spending amounts, with a spring and fall increase. The polynomial fit shows a significant seasonal pattern. Halloween and Christmas spending estimates are from 2023.


Back-to-school Spending
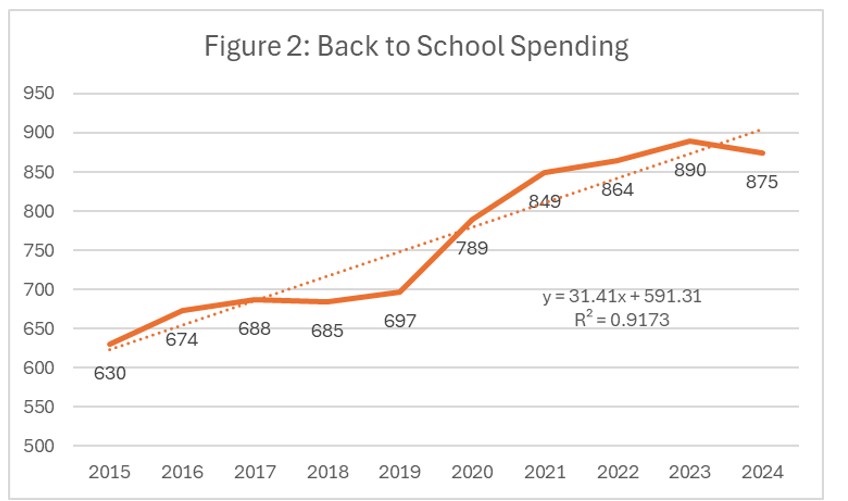
The average back-to-school spending is $874 per family. This translates to an estimated $38.8 billion for the entire country. Electronics and computers are the largest category with an average of $468 and include equipment such as a home computer, laptop, cell phone, tablet, or MP3 player. However, only 66% of the family makes such purchases, so the weighted contribution is shown in Table 2. It still comprises the largest single category. As shown in Table 3, laptops and tablets lead the list. As is shown in Figure 2, this overall spending has increased by an average of $31 per year since 2015.
Table 2: Back-to-school Spending by Category
| Average Spend | Percent | Weighted Spend | |
| Clothing and accessories | 269.50 | 94.0 | 253.33 |
| Shoes | 185.03 | 92.1 | 170.41 |
| School Supplies | 148.91 | 95.1 | 141.62 |
| Electronics/computer | 467.58 | 66.2 | 309.54 |
| Total | 874.90 |
Table 3: Types of Electronic or Computer-Related Equipment
| Laptop | 48.2 |
| Tablet | 33.6 |
| Calculator | 29.4 |
| Electronic accessories (mouse, flash drive, charger) | 27.2 |
| Speakers/Headphones | 24.3 |
| Smartphone/Cell phone | 23.6 |
| Home/Desktop computer | 15.7 |
| Printer | 15.4 |
| Smartwatch/ Activity Tracker | 9.3 |
| TV | 7.3 |
| Digital camera / Digital recorder | 5.7 |
| Gaming system | 4.4 |
As shown in Table 4, the largest category of planned back-to-school purchases is online, with over 56%. This is followed by department stores and discount stores. Note that the percentages reflect multiple categories.
Table 4: Where Will You Purchase
| Online | 56.6 |
| Department store | 49.8 |
| Discount store | 46.6 |
| Clothing store | 41.6 |
| Electronics store | 23.2 |
| Office Supplies store | 22.1 |
| Local/Small Business | 16.3 |
| Thrift Stores/Resale Shops | 8.5 |
| Drug Store | 5.4 |
| Catalog | 5.0 |
Most back-to-school shoppers, nearly 70%, say they have seen higher prices this year, as shown in Table 5. This ignores the 10% that say they haven’t started shopping yet. Clothing and accessories lead the list of product categories, followed by school supplies, such as notebooks, folders, pencils, backpacks, and lunchboxes. Although down the list, personal care items, such as skin care, hair care, oral care, makeup, and OTC medicine, are seen as higher by nearly 44%.
Table 5: Seen Higher Prices on Back-to-School Items
| Seen Higher Prices | Which Items | |||
| Yes, much higher | 26.3 | Clothing and accessories | 79.4 | |
| Yes, somewhat higher | 43.2 | School supplies | 68.9 | |
| The same | 16.0 | Shoes | 62.9 | |
| No, somewhat less | 2.9 | Electronics or computer-related equipment | 57.4 | |
| No, much less | 1.3 | Personal care items | 43.9 | |
| I haven’t started shopping yet | 10.3 | Furniture | 22.1 | |
Roughly two-thirds of shoppers say they might consider gently used items, as shown in Table 6. Clothing and accessories are the largest category considered. The primary reasons are to save money and afford higher-end and one-of-a-kind items.
Table 6: Consider Gently Used Items
| Consider Buying Gently Used | Primary Reasons | |||
| Clothing and accessories | 39.6 | Save money | 45.1 | |
| Shoes | 19.6 | Be more sustainable | 24.5 | |
| School supplies | 22.6 | Greater value | 24.7 | |
| Electronics or computer-related equipment | 28.2 | Afford higher-end brands | 15.4 | |
| None of the above | 32.5 | Find one-of-a kind item | 11.2 | |
Back-to-school shoppers can be categorized by the characteristics of their children by grade, wearing uniforms, and being home schooled. Table 7 shows the percentages by school level and wearing a uniform. The school levels add to more than 100% because of multiple children. Note that nearly 27% wear uniforms, which means being enrolled in a private school. It is also worth noting that there are more children in high school than elementary school.
Table 7: Child Characteristics
| Elementary School | 43.8 |
| Middle School/Junior High | 36.7 |
| High School | 46.2 |
| Wear Uniform | 26.6 |
Just over 16% say they plan to homeschool their child, as shown in Table 8. Add this to the children wearing uniforms, and it appears that 42.3% of school-age children are not attending public schools.
Table 8: Homeschooling
| Plan to homeschool | 16.2 |
| Have they homeschooled before? | |
| No, this is their first school year | 10.8 |
| No, previously in a traditional school | 15.2 |
| Yes, they have been homeschooled since kindergarten | 41.1 |
| Yes, they have experience with both homeschooling and traditional schooling | 32.9 |
The leading reason for homeschooling is concern about school safety, followed by higher-quality education, as shown in Table 9. Again, note that there are often multiple reasons given.
Table 9: Reason For Homeschooling
| Concerns about school safety | 41.1 |
| Higher quality education | 38.9 |
| Child had a negative school experience | 34.6 |
| Child has a learning disability | 28.1 |
| Disagree with values taught in school | 26.6 |
The level of back-to-school spending can be easily compared by calculating indices, as shown in Table 10. The overall average is 100. The least spending is for elementary children, with an index of 95. The school categories are not mutually exclusive, meaning there needs to be only one child in a category, such as elementary. The highest is middle school, with an index of 105. Of interest are the higher indices for both uniform-wearing children and homeschooled children. Perhaps this is a measure of parental concern.
Table 10: Spending Indices by Child Characteristics
| Elementary | Middle | High | Uniform | Homeschool | |
| Clothing and accessories | 94 | 102 | 104 | 113 | 110 |
| Shoes | 94 | 108 | 98 | 140 | 131 |
| School Supplies | 96 | 108 | 97 | 147 | 159 |
| Electronics/computer | 95 | 104 | 102 | 100 | 103 |
| Total | 95 | 105 | 101 | 117 | 119 |
Three factors are related to the amount of back-to-school planned spending, household income, whether living in an urban, suburban, or rural environment, and of course, the number of children. Figure 3 shows the back-to-school spending by the number of school-aged children. Note that 5 includes 5 and more. Using a simple linear model, the number of children is moderately associated with the spend (R2=.63). The average increment per child is just over $50, which indicates some economies of scale in having multiple children. The incremental change per child is a decrease when five are reached.
