Executive Summary
Halloween remains one of America’s most celebrated and commercially influential holidays—blending tradition, creativity, and commerce. Insights from the September 2025 Prosper Insights and Analytics survey (n = 8,045) reveal that while celebration rates remain steady, the way and where consumers draw inspiration and make purchases are evolving.
- 5% of U.S. adults plan to celebrate Halloween in 2025, maintaining its position among the top three most widely observed holidays.
- Average household spending is expected to exceed $160, with costumes ($53) and decorations ($47) driving the majority of purchases.
- Discount stores (42.4%) remain the leading shopping channel but continue to lose share each year, while online shopping (30.9%) grows at +1.45% annually.
- TikTok is the fastest-growing source of costume inspiration (+3.05% annually), signaling a major shift toward creator-led and trend-based purchasing behavior.
- Social media platforms such as TikTok, Instagram, and YouTube now play a central role in shaping both inspiration and intent—connecting digital discovery directly to in-store and online sales.
From Pinterest to TikTok: Where Halloween Shoppers Really Get Their Ideas in 2025
By Dr. Martin Block, Professor Emeritus, Northwestern University, Retail Analytics Council
Halloween is a major retail event that rivals the Super Bowl and Father’s Day in popularity. Adults were asked about Halloween in the September 2025 Prosper Insights and Analytics survey (n = 8,045). In response to the question, “Do you plan to celebrate Halloween or participate in Halloween activities this year?” The percentages shown in Table 1 are for 2024, except for the November and December items, which are for 2023.
Table 1: Holidays by Month
| Month | Holiday | Percent |
| January | Super Bowl | 76.9 |
| February | St. Patrick’s Day | 61.9 |
| Valentines Day | 52.0 | |
| Easter | Celebrate Easter | 80.7 |
| May | Mother’s Day | 84.2 |
| June | Father’s Day | 75.4 |
| Graduation | 33.6 | |
| July | 4th of July | 87.2 |
| August | Back to School | 40.1 |
| October | Halloween | 72.5 |
| November | Thanksgiving* | 73.9 |
| December | Christmas* | 93.4 |
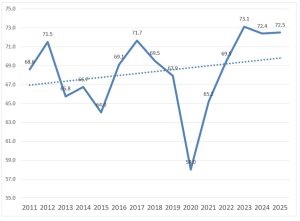
Overall, 72.5% of respondents reported planning to celebrate. Figure 1 shows the trend for responses to this question since 2011. The 2024 results represent a very small increase from 2024 of 72.4%. It is noteworthy that Halloween celebrations dropped sharply during the pandemic, reaching a low of 58.0%. Even with the pandemic, the proportion celebrating Halloween has increased at an average rate of 0.21% per year.
Figure 1: Celebrating Halloween by Year
Among those planning to celebrate, the most popular activity is handing out candy, as shown in Table 2. Note that these activities are not mutually exclusive. Decorating for the holiday is reported by 51%, and nearly the same percentage, 51%, say they dress in a costume. Over one in five (23%) say they plan to dress their pets.
Table 2: Halloween Celebration Plans
| Percent | |
| Hand out candy | 66.0 |
| Dress in Costume | 51.2 |
| Decorate your home/yard | 50.7 |
| Carve a pumpkin | 45.6 |
| Throw/attend a party | 32.3 |
| Take children trick-or-treating | 26.7 |
| Visit a haunted house | 23.8 |
| Dress your pet(s) in a costume | 22.7 |
| Other | 3.6 |
Halloween Spending
The average Halloween spending is expected to be just over $160 per household. The largest categories are costumes at $53 and decorations at $47, as shown in Table 3. Halloween spending compares to the Fourth of July, with $87, Father’s Day at $185, and Mother’s Day at $254.
Table 3: Halloween Spending by Category
| 2025 | AGR | |
| Costumes | 52.78 | 1.15 |
| Candy | 35.65 | 1.24 |
| Decorations | 47.38 | 1.78 |
| Cards | 24.86 | 0.57 |
| Total | 160.67 | 4.97 |
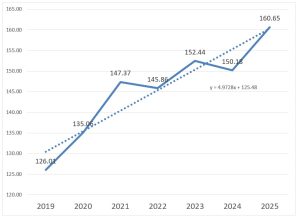
The average spending steadily increases, as shown in Figure 2. On average, the annual increase is just under $5.00, with a notable increase of nearly $10.00 in 2025 compared to 2024.
Figure 2: Halloween Spending Trend
The pattern of planned spending is also changing, as shown in Table 4. Discount stores are the largest category in 2025, accounting for 42.4%, but this share is decreasing at an annual rate of 0.98%. Online Halloween shopping stands at 30.9% and is growing at an annual rate of 1.45%. Note that the percentages reflect multiple categories. Halloween shopping is done through a variety of outlets and retail categories.
Table 4: Where Will You Purchase (Percent)
| 2025 | AGR | |
| Discount store | 42.4 | -0.98 |
| Specialty Halloween/costume store | 31.1 | -0.18 |
| Online | 30.9 | 1.45 |
| Department store | 25.1 | 0.25 |
| Grocery store/supermarket | 24.6 | 0.20 |
| Home décor store | 21.3 | 0.82 |
| Crafts or fabrics store | 14.0 | 0.00 |
| Home improvement store | 13.5 | 0.64 |
| Local/small business | 12.1 | 0.40 |
| Clothing store | 11.1 | 0.27 |
| Thrift store/resale shops | 11.1 | 0.09 |
| Greeting card/gift store | 8.6 | 0.01 |
| Drug store | 5.8 | -0.37 |
| Catalog | 4.1 | -0.03 |
Where Halloween celebrators say they look for inspiration for costumes is shown in Table 5. The leading categories include online search at 37.1% and various social networks. TikTok is by far the fastest-growing. Even though 42% still shop at discount stores, the path to purchase increasingly begins online — especially on TikTok. It is interesting that “friends and family” stands at 21.1% with no growth. Retail stores are second at 26.9%, but this is decreasing. Again, the categories are not mutually exclusive. Only about one in five (22.3%) say they will not wear a costume.
Table 5: Where to Look for Inspiration (Percent)
| 2025 | AGR | |
| Online Search | 37.1 | 0.39 |
| Within a retail store or costume shop | 26.9 | -0.08 |
| Does not apply/Will not wear costume | 22.3 | -0.62 |
| Friends/Family | 21.1 | 0.23 |
| 19.6 | 1.01 | |
| YouTube | 18.6 | 0.60 |
| 19.9 | 0.35 | |
| Pop Culture (celebrities, TV shows, movies, etc.) | 17.8 | 0.28 |
| 17.9 | -0.24 | |
| Tik Tok | 17.6 | 3.05 |
| Print Media (magazines, catalogs, etc.) | 8.7 | -0.41 |
| X (Formerly Twitter) | 8.6 | 0.29 |
| Current Events | 8.2 | 0.19 |
| Habit/Wear the same costume each year | 6.2 | 0.08 |
| Blogs | 3.3 | -0.03 |
| Other | 2.7 | -0.03 |
Summary
Halloween’s influence extends far beyond aisles lined with candy and costumes—it now lives on social media feeds. TikTok, Instagram, and YouTube are driving not only costume inspiration but also shaping what consumers buy, where they buy it, and how quickly trends move from screen to shelf. TikTok’s 3% annual growth rate as a source of costume ideas underscores how real-time, creator-led content can spark immediate purchasing behavior.