Executive Summary:
While Mother’s Day celebration rates have shown stability over the years, there have been notable shifts in spending preferences, with a growing emphasis on experiences and online and local shopping. Understanding celebrator demographics and preferences can guide retailers in catering to this significant consumer segment.
- Mother’s Day Significance: Mother’s Day is the third most popular American holiday, following Christmas and the 4th of July, with 84.2% of respondents celebrating it. This popularity is due not just to maternal recognition but also to its expansive scope of celebration.
- Recipient Demographics and Spending: Among celebrators, the average spend is $254.04, with 58.8% honoring mothers or stepmothers and 21.8% celebrating wives. The total spend increases with the number of recipients.
- Gift Preferences: Flowers and greeting cards continue to be popular, but there is a noticeable shift in preferences. However, spending on physical items like clothing, jewelry, and housewares has declined. Celebrators are increasingly opting for experiences over physical gifts.
- Economic Impact: Mother’s Day contributes $33.5 billion to the U.S. economy, with flowers contributing $3.2 billion and greeting cards $1.1 billion.
- Pressure on Gift Buyers: Gift buyers face mounting pressure exacerbated by inflation and the quest for unique presents. Navigating this complexity adds layers to the gift-buying process.
- Consumer Behavior: Online purchases lead at 35.4%, followed by department and specialty stores, meaning Mother’s Day gifts are most likely to be purchased online. Local/small businesses and online shopping have grown, while specialty clothing stores have declined. Over two-thirds of celebrators seek gift inspiration from retailers, and finding unique gifts is a top priority. There’s a growing interest in subscription box services as gifts.
- Romantic Undertones: Mother’s Day carries romantic undertones, with wives receiving the highest spend. The emphasis on experiences over physical gifts underscores its role as a romantic holiday.
- Celebrator Demographics: Celebrators tend to be male, married, with children, and higher income earners. African American, Asian, and Hispanic groups are more likely to celebrate, with Gen-Z and Millennials showing higher celebration rates.
- Happiness and Celebration: Mother’s Day celebrators report heightened levels of happiness, establishing a clear link between celebrating the occasion and overall well-being.
Retail Trends, Spending, and Mother’s Day Celebratory Patterns
By Dr. Martin Block, Professor Emeritus, Northwestern University, Retail Analytics Council
Mother’s Day (Sunday, May 12, 2024) is the third most popular American holiday. Celebrating Mother’s Day is among the topics covered by Prosper Insights & Analytics (www.ProsperInsights.com) in the monthly online surveys that collect data about annual events and related market behavior. Celebrating Mother’s Day was asked in the April 2024 survey (n=8,213). In response to the question, “Do you expect to spend more, the same, or less for Mother’s Day than you spent last year?” Of the total, 15.8% said they don’t celebrate Mother’s Day, leaving 84.2% who do. As shown in Table 1, Mother’s Day ranks between the 4th of July and Easter.
Table 1: Seasonal Holiday Participation
| Percent | |
| Christmas | 93.4 |
| 4th of July | 87.2 |
| Mother’s Day | 84.2 |
| Celebrate Easter | 80.7 |
| Super Bowl | 76.9 |
| Father’s Day | 75.3 |
| Halloween | 73.1 |
| St. Patrick’s Day | 61.9 |
| Valentines Day | 52.0 |
Recent Mother’s Day Celebration History
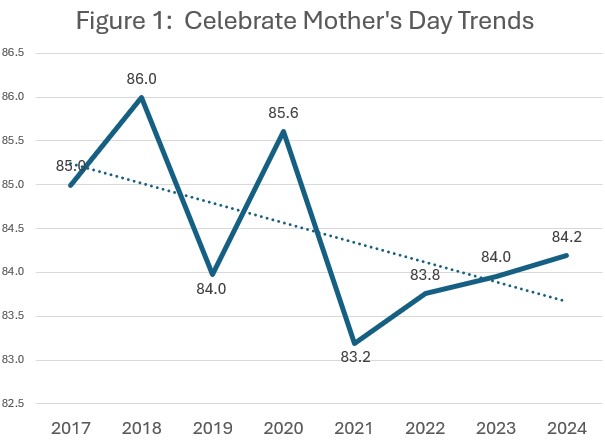
The Mother’s Day celebration rate has decreased slightly over the past eight years, as shown in Figure 1. The rate dropped sharply in 2021, no doubt related to COVID-19, and has a slight decrease at -0.22 per year. The rate, however, has increased slightly since then.
Celebrating Mother’s Day is more complicated because it can involve different people, and often, more than one mother is celebrated. Among the 84.2% who say they celebrate Mother’s Day, they claim 1.5 recipients. This includes 66.9% who cite only one recipient, 22.5% who say two, and 10.6% who say three or more. Among those who celebrate, the overall average spend of $254.04 is reported. Table 2 shows that, by far, the most common recipient is a mother or stepmother, at 58.8%. This is followed by a wife at 21.8%. As the number of recipients goes up, so does the total spend. Those claiming a godmother are claiming 3,6 recipients and a total spend of $419.06. Dividing the total spend by the number of recipients provides an estimate for a single recipient by category. Wives lead at $145.26, followed by mothers at $120.01.
Table 2: Mother’s Day Spend and Recipients
| Total | Number of | Spend per | ||
| Percent | Spend | Recipients | Recipient | |
| Mother or Stepmother | 58.8 | 191.67 | 1.6 | 120.01 |
| Wife | 21.8 | 280.58 | 1.9 | 145.26 |
| Daughter | 11.7 | 257.69 | 2.2 | 116.11 |
| Sister | 10.5 | 273.81 | 2.7 | 99.65 |
| Friend | 9.1 | 269.44 | 2.7 | 100.58 |
| Other relative | 8.3 | 191.81 | 2.2 | 85.61 |
| Grandmother | 7.4 | 311.93 | 2.9 | 108.87 |
| Godmother | 2.3 | 419.06 | 3.6 | 116.08 |
| All | 254.04 | 111.52 |
Flowers and greeting cards are the most common items purchased, as shown in Table 3. The categories are ranked by how often they are purchased. Special outings beyond dinner or brunch include concert or sporting event tickets, hot air balloon rides, gym membership, spa service, art or learning classes, etc. All categories, except greeting cards, have increased over the last eight years, but flowers have decreased since 2023. The sharpest year-over-year percentage decreases are in physical items such as clothing, jewelry, housewares, and gardening tools.
Table 3: Planned Mother’s Day Buying
| AGR % | Year over | |||
| Percent Buying | 2024 | AGR | of 2024 | Year% |
| Flowers | 74.3 | 1.0 | 1.3 | 0.4 |
| Greeting card(s) | 73.7 | -0.5 | -0.7 | -0.9 |
| Special outings, such as dinner or brunch | 59.3 | 0.6 | 1.1 | -1.1 |
| Gift Card(s)/Certificate(s) | 51.3 | 1.3 | 2.5 | -4.8 |
| Clothing or clothing accessories | 43.3 | 1.5 | 3.4 | -9.0 |
| Jewelry | 40.3 | 1.2 | 3.1 | -8.7 |
| Personal Service, such as a day at a spa, a facial, or a massage | 31.5 | 1.4 | 4.4 | -6.4 |
| Housewares or gardening tools | 27.1 | 1.6 | 6.0 | -11.8 |
| Books or CDs | 23.6 | 0.9 | 3.9 | -14.5 |
| Consumer electronics or computer-related accessories | 21.0 | 1.4 | 6.9 | -16.7 |
| Other | 27.3 | 0.7 | 2.7 | -4.6 |
The approach to spending in 2024, as shown in Table 4, favors spending on experiences rather than physical gifts, which is reflected in the changes in spending.
Table 4: Approach to Celebrating Mother’s Day
| Percent | |
| Prioritize spending on experiences such as a special meal or a spa day over spending on physical gifts. | 57.2 |
| Prioritize spending on a special item, such as a gift of jewelry, electronics, or clothing, over an experience. | 42.8 |
As shown in Table 5, the amount planned to spend is less in every physical gift category compared to last year except consumer electronics. Even gift cards are down nearly 3.5%. Experience categories, such as special outings and personal service, are increasing. All categories are increasing over when compared to the last eight years. The drop from last year no doubt reflects the current economy. Jewelry is the highest spend item, with an average 3.2% eight-year growth, but a 2.8% drop from last year.
Table 5: Planned Mother’s Day Spend Amounts
| AGR % | Year over | |||
| Buyer Spend | 2024 | AGR | of 2024 | Year |
| Jewelry | 131.90 | 4.18 | 3.17 | -2.81 |
| Consumer electronics or computer-related accessories | 126.78 | 2.48 | 1.96 | 3.96 |
| Special outings, such as dinner or brunch | 75.85 | 2.19 | 2.89 | 5.07 |
| Personal Service, such as a day at a spa, a facial, or a massage | 70.65 | 1.52 | 2.16 | 3.17 |
| Clothing or clothing accessories | 52.57 | 1.26 | 2.40 | -2.91 |
| Housewares or gardening tools | 49.90 | 1.61 | 3.23 | -1.31 |
| Gift Card(s)/Certificate(s) | 47.09 | 0.74 | 1.57 | -3.47 |
| Flowers | 32.18 | 0.44 | 1.36 | -2.47 |
| Books or CDs | 24.62 | 0.61 | 2.49 | -2.85 |
| Greeting card(s) | 11.06 | 0.48 | 4.33 | -7.27 |
| Other | 32.27 | 0.44 | 1.37 | -0.03 |
The overall economic impact, multiplied by spending, participation, and population size, provides an estimate of the total economic impact, as shown in Table 6. Mother’s Day contributes $33.5 billion to the U.S. economy, down 6.1% from last year. Flowers alone contribute $3.2 billion, and greeting cards $1.1 billion.
Table 6: Estimated Economic Impact
| AGR % | Year over | |||
| Billions | 2024 | AGR | of 2024 | Year |
| Jewelry | 7.0 | 0.4 | 6.1 | -10.2 |
| Special outings, such as dinner or brunch | 5.9 | 0.2 | 4.1 | 5.2 |
| Consumer electronics or computer-related accessories | 3.5 | 0.3 | 8.2 | -12.4 |
| Gift Card(s)/Certificate(s) | 3.2 | 0.1 | 4.2 | -6.9 |
| Flowers | 3.2 | 0.1 | 2.9 | -0.9 |
| Clothing or clothing accessories | 3.0 | 0.2 | 5.7 | -10.5 |
| Personal Service, such as a day at a spa, a facial, or a massage | 2.9 | 0.2 | 6.2 | -2.2 |
| Housewares or gardening tools | 1.8 | 0.2 | 8.5 | -11.8 |
| Greeting card(s) | 1.1 | 0.0 | 4.1 | -7.0 |
| Books or CDs | 0.8 | 0.0 | 6.3 | -15.9 |
| Total | 33.5 | 1.8 | 5.5 | -6.1 |
Where celebrators are spending their money is also changing. Table 7 shows that online is the leading source for gift purchases, with just over 35%. Online and local small businesses are both increasing, including over the last year. Specialty clothing stores, while increasing over the last eight years, have dropped sharply compared to last year.
Table 7: Retail Outlets
| AGR % | Year over | |||
| 2024 | AGR | of 2024 | Year | |
| Online | 35.4 | 0.71 | 2.02 | 4.69 |
| Department Store | 32.3 | -0.35 | -1.09 | -3.76 |
| Specialty Store (Greeting Card/Gift Store, Florist, Jeweler, Electronics Store) | 29.3 | -0.11 | -0.37 | -0.78 |
| Local/Small Business | 25.5 | 0.21 | 0.81 | 5.12 |
| Discount Store | 22.5 | 0.05 | 0.24 | -3.46 |
| Specialty Clothing Store | 12.4 | 0.51 | 4.12 | -7.68 |
| Catalog | 2.0 | 0.06 | 2.98 | -25.06 |
As shown in Table 8, the majority, over two-thirds, say they look to the retailer for gift inspiration. This represents a substantial opportunity for the retailer.
Table 8: Look to Retailers for Gift Inspiration
| Percent | |
| Always | 13.0 |
| Very often | 21.0 |
| Sometimes | 33.7 |
| Not very often | 16.2 |
| Never | 16.1 |
Table 9 shows what is important to celebrators when purchasing Mother’s Day gifts. At 48%, the leading reason is finding a unique or different gift. This was followed by finding a gift that creates a special member at 43%. Convenience and cost-effectiveness are much lower on the list.
Table 9: Importance in Gift Purchasing
| Percent | |
| Finding a gift that’s convenient for me | 25.2 |
| Finding a gift that’s unique or different | 47.5 |
| Finding a gift that’s cheaper or most cost-effective | 18.9 |
| Finding a gift that creates a special memory | 42.9 |
| Other | 6.6 |
Over half of celebrators say they have not changed how they celebrate Mother’s Day since before the pandemic, as shown in Table 10. The top reported change is adding new traditions, such as outings, which is consistent with previous findings. Nearly one-fifth say they are celebrating more people.
Table 10: Changed Approach since the Pandemic (2019)
| Percent | |
| Celebrating more people than I did before | 18.1 |
| Adding new traditions like a Mother’s Day outing, brunch, or spa day | 20.1 |
| Focusing on more “splurge” gifts like jewelry or electronics | 12.3 |
| Other | 2.6 |
| Not changed how I celebrate or did not celebrate Mother’s Day before the pandemic. | 57.8 |
Another possible gift is a subscription box service. Celebrators were asked how interested they would be in gifting a product subscription box service this Mother’s Day. This includes services like Birchbox, LeTote, Stitchfix, and Fresh Direct, where the recipient receives a selection of clothing, beauty products, food, or other items regularly. Table 11 shows that 42% are interested, and 38% are not interested at all.
Table 11: Interest in a Product Subscription Box Service
| Percent | |
| Very interested | 15.5 |
| Somewhat interested | 26.1 |
| Not very interested | 20.2 |
| Not interested at all | 38.1 |
Mother’s Day Celebrators
Describing who the Mother’s Day celebrators are is shown in Tables 12 and 13. The comparison is made according to the change in planned spend since last year. Just over 22% plan to spend more, while only 11% plan to spend less. This leaves 51% who plan to spend the same. The 15.8% that don’t celebrate is reported earlier. To facilitate comparison, an index is computed comparing the percentage of those who don’t celebrate to the total. As shown in Table 12, celebrators are more likely to be male, married, and have children. Having children seems to be the most important predictor. Those who don’t celebrate are likely divorced, separated, or windowed. Celebrators also have a higher income.
Table 12: Celebrator Demographics
| More | Same | Less | Don’t | |||
| Percent | 22.3 | 51.1 | 10.8 | 15.8 | 100 | Index |
| Female | 37.9 | 54.4 | 64.1 | 57.8 | 52.1 | 110.9 |
| Married | 43.1 | 43.4 | 36.9 | 31.1 | 40.7 | 76.4 |
| Living with Unmarried Partner | 10.4 | 8.2 | 11.4 | 7.9 | 9.0 | 87.8 |
| Divorced or separated | 6.2 | 12.5 | 15.9 | 19.0 | 12.5 | 152.0 |
| Widowed | 2.2 | 4.7 | 6.0 | 9.6 | 5.0 | 192.0 |
| Single, never married | 38.1 | 31.2 | 29.8 | 32.3 | 32.8 | 98.5 |
| Have Children | 53.9 | 31.3 | 32.7 | 9.5 | 33.4 | 28.4 |
| Income ($000) | 68.0 | 65.5 | 52.0 | 56.3 | 63.2 | 89.0 |
African American, Asian, and Hispanic groups are more likely to celebrate Mother’s Day, as shown in Table 13. This is especially true among Hispanics, noting the very low index among those who don’t celebrate. Age is also important, with the number of celebrators being highest among Gen-Z and Millennials. The average age among non-celebrators is nearly 60 compared to the total population of adults at 48. Non-celebrators are also more likely to live in rural areas.
Table 13: Celebrator Characteristics
| More | Same | Less | Don’t | |||
| Percent | 22.3 | 51.1 | 10.8 | 15.8 | 100.0 | Index |
| African American | 17.6 | 11.3 | 13.5 | 9.4 | 12.7 | 74.0 |
| Asian | 4.3 | 4.6 | 4.4 | 3.0 | 4.3 | 69.8 |
| Multi-Racial | 1.1 | 1.3 | 1.4 | 1.4 | 1.3 | 107.7 |
| White | 49.9 | 65.5 | 59.7 | 74.3 | 62.6 | 118.7 |
| Hispanic | 21.3 | 12.9 | 15.7 | 7.7 | 14.3 | 53.8 |
| Gen-Z | 32.0 | 16.3 | 14.8 | 8.0 | 18.5 | 43.2 |
| Millennials | 38.3 | 25.1 | 24.5 | 12.6 | 26.2 | 48.1 |
| Gen-X | 21.6 | 28.8 | 30.0 | 20.9 | 26.1 | 80.1 |
| Boomers | 7.8 | 27.4 | 28.8 | 51.9 | 26.7 | 194.4 |
| Seniors | 0.3 | 2.4 | 1.9 | 6.5 | 2.5 | 260.0 |
| Average Age | 37.9 | 48.7 | 49.2 | 58.5 | 47.7 | 122.6 |
| Rural | 20.7 | 23.5 | 27.0 | 26.6 | 23.7 | 112.2 |
| Urban | 45.9 | 37.9 | 40.4 | 37.0 | 39.9 | 92.7 |
| Suburban | 32.7 | 38.0 | 32.2 | 35.7 | 35.8 | 99.7 |
Happiness
Respondents are asked to rate their overall happiness across ten categories on a five-point scale. Table 14 shows the proportion of the combination of happy and totally happy. The unmistakable conclusion is that those who plan to celebrate Mother’s Day are happier than those who do not, as shown in the composite average. The biggest differences are in religion, love life, work life, and government, as seen among previous Easter celebrators in last month’s Retail Tech Bulletin article, “Retail Trends, Spending, and Easter Celebratory Patterns.”
Table 14: Happiness by Mother’s Day Celebration
| More | Same | Less | Don’t | Total | Index | |
| Percent | 22.3 | 51.1 | 10.8 | 15.8 | 100.0 | |
| Work Life | 54.0 | 43.3 | 33.5 | 32.3 | 43.0 | 75.1 |
| Government | 36.0 | 22.0 | 14.2 | 18.3 | 23.8 | 76.9 |
| Love Life | 58.9 | 53.7 | 42.0 | 41.2 | 51.8 | 79.5 |
| Religion/Faith | 64.5 | 58.3 | 51.1 | 49.7 | 57.6 | 86.2 |
| Health | 61.5 | 55.5 | 45.7 | 48.1 | 54.7 | 87.8 |
| Relationships with Family | 68.0 | 67.6 | 55.2 | 57.6 | 64.8 | 88.9 |
| Relationships with Friends | 65.1 | 64.3 | 53.9 | 59.7 | 62.6 | 95.2 |
| Home Life | 67.1 | 65.3 | 54.2 | 61.3 | 63.9 | 95.8 |
| Neighborhood | 62.8 | 60.5 | 51.0 | 58.3 | 59.7 | 97.7 |
| House/apartment/condo | 63.3 | 62.2 | 49.7 | 59.4 | 60.7 | 97.9 |
| Composite | 53.7 | 49.4 | 39.9 | 43.6 | 48.5 | 89.9 |
Summary
Mother’s Day ranks between the 4th of July and Easter. Celebrating the day has remained almost flat in the last eight years. Spending, however, is also down, especially on physical gifts. The presence of children, age, marital status, and income are the strongest predictors of planning to celebrate. Celebrators are shopping more online and at local businesses. Mother’s Day celebrators are also happier than those who don’t plan to celebrate.