Executive Summary
The Super Bowl continues to operate as a major cultural and consumer event, with participation levels rivaling traditional U.S. holidays and spending patterns that extend well beyond the game itself. Findings from the January 2026 Prosper Insights & Analytics survey conducted in cooperation with the National Retail Federation (n=7,991) show that Super Bowl viewing has reached an all-time high, driven by a combination of entertainment, social gatherings, and food-centered experiences, while consumer engagement with advertising shows signs of gradual softening. Key findings include
- 79.9% of U.S. adults plan to watch the Super Bowl in 2026, up from 76.9% in 2025 and the highest level recorded
- Super Bowl viewing has grown at an average annual rate of 0.22%, rebounding from pandemic-era declines
- The game remains the top viewing driver (33.5%), followed by the halftime show (17.0%), commercials (14.0%), and social elements
- Average planned Super Bowl party spending is $104.11, a 2.3% increase over 2025
- Food and beverages account for 81.2% of all party spending, far exceeding apparel, décor, or electronics
The Business of Watching the Super Bowl
By Dr. Martin Block, Professor Emeritus, Northwestern University, Retail Analytics Council
The Super Bowl has become a popular American pastime and part of the culture. Super Bowl watching is among the topics covered by Prosper Insights & Analytics, in cooperation with the National Retail Federation (NRF), which conducts monthly online surveys that collect data about annual events and related market behavior. Super Bowl viewing was asked in the January 2026 survey (n=7,991). In response to the question, “When you watch the Super Bowl, what is the most important part for you?”, 20.2% reported that they don’t watch the Super Bowl. This leaves 79.9% of all adults who say that they plan to watch it in 2025. This is up from the 2025 estimate of 76.9%. As shown in Table 1, the Super Bowl ranks near the top in terms of last year’s participation, alongside Father’s Day and Halloween. Only Christmas, the 4th of July, Mother’s Day, and Easter exceed it.
Table 1: Seasonal Holiday Participation
| Month | Holiday | Percent |
| January | Super Bowl | 79.9 |
| February | St. Patrick’s Day | 61.9 |
| Valentines Day | 54.6 | |
| Easter | Celebrate Easter | 80.7 |
| May | Mother’s Day | 84.2 |
| June | Father’s Day | 75.4 |
| Graduation | 33.6 | |
| July | 4th of July | 87.2 |
| Back to School | 40.1 | |
| October | Halloween | 72.4 |
| November | Thanksgiving Shopping | 74.3 |
| December | Winter Holidays | 92.8 |
| Christmas | 85.3 |
Recent Super Bowl History
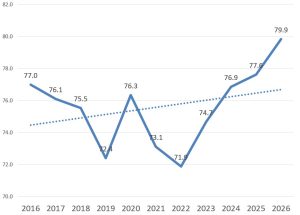
The anticipated viewing rate for the Super Bowl shows an annual growth rate of 0.22%. Viewing trends declined from 2016 to 2019, perhaps related to the political climate, then rebounded in 2020, only to fall again in 2021 and 2022, likely related to COVID-19. The 2026 level is an all-time high at 79.9%, exceeding the previous high levels of 2016 and 2025.
Figure 1: Super Bowl Watching Trend
Considerations of the other important factors reported in 2025 and 2026 are shown in Table 2. The overall watching percentage has increased slightly since 2025. Most Super Bowl factors have remained largely unchanged between 2025 and 2026. This is nearly identical to the game itself. Getting together with friends and fun food that is prepared for the game have both increased slightly, perhaps indicating greater emphasis on the social aspects.
Table 2: Importance of Super Bowl Factors
| 2025 | 2026 | |
| The Game | 33.4 | 33.5 |
| The Half Time Show | 14.9 | 17.0 |
| The Commercials | 13.5 | 14.0 |
| Getting together with friends | 10.4 | 10.0 |
| Fun food that is prepared for the game | 5.4 | 5.5 |
| Anticipate watching the game | 77.9 | 79.9 |
Super Bowl Parties
Fewer say they are not planning to throw or attend a party in 2026 compared to 2025, as shown in Table 3. The pattern is almost the same as in 2025: attending versus throwing a party.
Table 3: Planning or Throwing a Super Bowl Party
| 2025 | 2026 | |
| No | 49.9 | 36.7 |
| Yes, plan to attend a party | 25.9 | 20.9 |
| Yes, plan to throw a party | 17.4 | 16.3 |
| Plan to watch at a bar/restaurant | 6.7 | 5.6 |
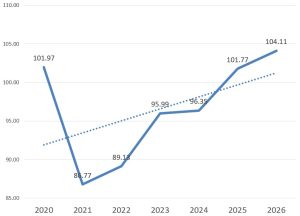
Planned spending has steadily increased, as shown in Figure 2. The 2026 average spending for those planning a party is $104.11, with an average annual growth rate of $1.56. The 2026 planned spend is 2.3% higher than 2025.
Figure 2: Average Planned Spend
As shown in Table 4, the overwhelming amount of party spending (81.2%) is on food and beverages. This is followed by team apparel (13.8%) and decorations (8.4%).
Table 4: Party Spending Categories
| Percent | |
| Food/Beverages | 81.2 |
| Team apparel or accessories (hats, coats, etc.) | 13.8 |
| Television | 9.8 |
| Decorations | 8.4 |
| Furniture (including entertainment centers) | 6.1 |
Super Bowl Commercials
As indicated previously in Table 2, the relative importance of Super Bowl commercials has remained almost the same from 2025 to 2026. Table 5 shows a decline in the entertainment value of Super Bowl commercials, although the proportion is still high at 62.4%. It is notable that the proportion saying “advertisers should save their money” is down, and the relative influence is also down.
Table 5: Super Bowl Commercials
| 2025 | 2026 | |
| I look at them as entertainment | 69.8 | 52.4 |
| They make me aware of advertiser brands | 19.6 | 16.4 |
| Advertisers should save their money and pass the savings on to us | 17.7 | 14.1 |
| They influence me to buy products from the advertisers | 14.5 | 13.0 |
| They influence me to search online for more information | 12.8 | 12.2 |
| They bother me | 6.4 | 6.8 |
| They make the game last too long | 6.8 | 6.2 |
Summary
The Super Bowl has become a cultural event that ranks with Father’s Day and Halloween. Planning to watch the Super Bowl has increased in 2026. As in past years, the game itself is less important to viewers, with parties, commercials, and the halftime show accounting for the rest.