Summary
The Super Bowl, deeply ingrained in American culture, significantly shapes consumer behavior and happiness. Prosper Insights & Analytics’ January 2024 survey of 8,239 participants delves into Super Bowl-watching intentions, shedding light on its broader impact.
- Prosper Insights & Analytics’ January 2024 survey reveals that 76.9% of adults plan to watch the Super Bowl in 2024, ranking it among the top events.
- Viewing trends remained consistent over nine years, with the 2024 level tied with the 2016 all-time high.
- Factors like COVID-19 affected Super Bowl viewing habits, with declining interest in watching the game.
- Demographics show higher male viewership (83.1%) than females (71.7%).
- Super Bowl watchers exhibit an increased likelihood of major purchases, with plans to buy more across various categories than non-watchers.
- Super Bowl watchers report higher happiness levels across multiple life categories than non-watchers.
- The importance of Super Bowl commercials has declined, with 71.1% seeing them as entertainment.
- Despite a slight decrease in party plans, Super Bowl party spending has steadily increased, with an average 2024 spend of $102.27.
- Retail club memberships, especially Amazon Prime, are higher among Super Bowl watchers.
Overall, the Super Bowl’s cultural impact extends beyond the game, influencing consumer behavior, party dynamics, and happiness levels.
Super Bowl Watching: Impacts on Consumer Behavior and Happiness
By Dr. Martin Block, Professor Emeritus, Northwestern University, Retail Analytics Council
The Super Bowl has become a popular American pastime and an integral part of the culture. Prosper Insights & Analytics conducts monthly online surveys, gathering data on annual events and associated market behavior, including the Super Bowl. The January 2024 survey (n=8,239) included a question about Super Bowl viewing intentions.
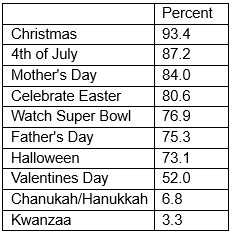
In response to the query, “When you watch the Super Bowl, what is the most important part for you?”, 23.1% indicated that they don’t watch the Super Bowl. Consequently, 76.9% of all adults expressed their intention to watch it in 2024. As shown in Table 1, this significant interest places the Super Bowl among the top-ranked events for 2023 participation, alongside Father’s Day and Halloween, surpassed only by Christmas, the 4th of July, Mother’s Day, and Easter.
This article delves into Super Bowl-watching intentions and explores their connection with reported shopping behavior, shedding light on the broader impact of this event.
Table 1: Seasonal Holiday Participation
Recent Super Bowl History
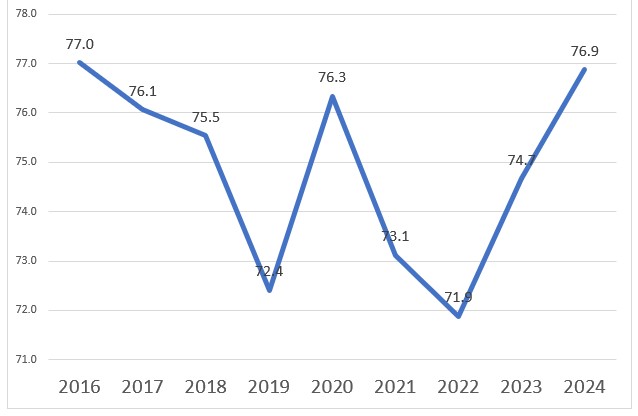
The rate of anticipated viewing of the Super Bowl has remained reasonably consistent over the past nine years, as shown In Figure 1. Viewing trends are declining from 2016 to 2019, perhaps related to the political climate, then rebounding in 2020, to fall again in 2021 and 2022, no doubt related to COVID. The 2024 level is virtually tied with the 2016 all-time high.
Figure 1: Super Bowl Watching Trends
Considerations of the other important factors reported in 2024 are shown in Table 2. Despite the increases in the last two years, the overall watching percentage has declined at an average annual rate of -0.19%. This is almost the same as the game itself. Getting together with friends has also declined, which can be attributed to COVID-19, with the decline beginning in 2021. The importance of commercials has steadily declined since 2018, while watching the halftime show has steadily increased since 2019. Watching the game itself is identified by only 43.8% as being most important.
Table 2: Importance of Super Bowl Factors
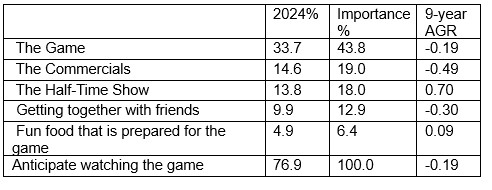
Table 3: Importance of Super Bowl Factors by NFL Presence
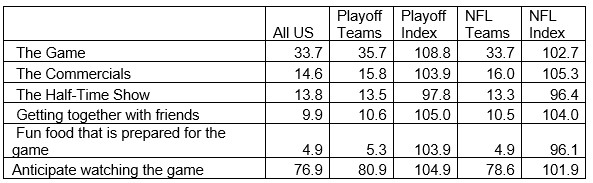
Aggregating TV markets, Nielsen DMAs, according to the presence of a NFL franchise and if the team has made the playoffs in 2024 is compared in Table 3. Of the 32 NFL, 30 are associated with a TV market. Both New York (Giants and Jets) and Los Angeles (Rams and Chargers) have two. The Carolina Panthers are associated with Charlotte, and the Tennessee Titans with Nashville, where they both play home games. Green Bay is an anomaly, being the smallest TV market. The NFL-associated TV markets comprise almost exactly half (50.0%) of the January sample, whereas the 14 playoff markets comprise 23.1%. Indexing to all adults, there is a small increase among NFL markets, with an index of 101.9, and higher among playoff markets, with an index of 104.9. The game itself indexes the highest among playoff markets at 108.8. Both are getting together with friends, and the commercials index is higher among both NFL and playoff markets. The halftime show rates the highest among non-NFL markets.
Super Bowl Viewers
A classification regression tree (CRT) is a reasonable way to determine some of the characteristics of the Super Bowl watcher. Using the overall proportion of 76.9%, gender, age, income, presence of children, and whether there is a playoff team in the market. Figure 2 shows the first split by gender, with males at 83.1% and females at 71.7%. While watching is more likely among males, a substantial majority of females still watch. The highest node is among males, earning $53,000 and having children at 92.9%. In most cases, watching seems to increase with income for both genders. Males with lower incomes (under $53,000) and older (over 57) watch more if they are in a playoff market.
Figure 2: Super Bowl Watcher Segmentation Tree

Super Bowl Parties
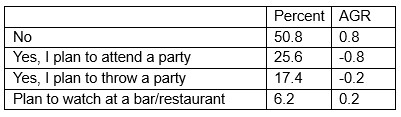
Among those planning to watch the Super Bowl, about 43% say they plan to throw or attend a party, as shown in Table 4. The nine-year growth rate, however, is negative for both planning and throwing a party. While still small, planning to watch at a bar or restaurant is growing slightly.
Table 4: Planning or Throwing a Super Bowl Party, 2024
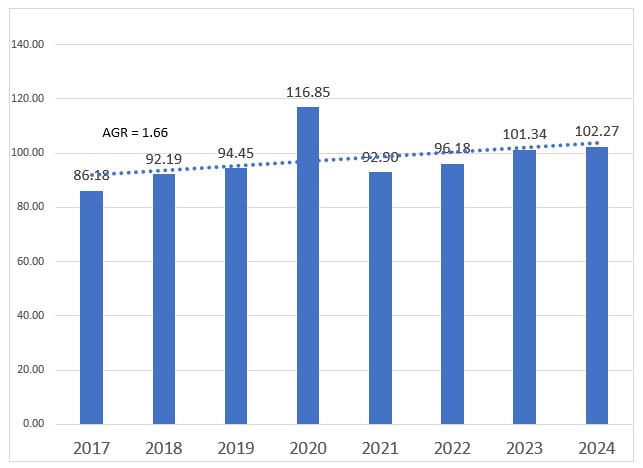
Despite the small decrease in party plans, the spending has steadily increased, as shown in Figure 3. The 2024 average spend for those planning a party is $102.27, with an average annual growth rate of $1.66.
Figure 3: Average Planned Spend
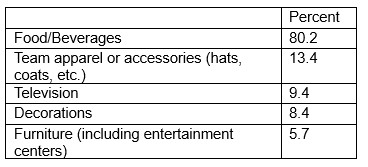
As shown in Table 5, the overwhelming amount of party spending (80.2%) is on food and beverages. This is followed by team apparel at 13.4% and decorations at 8.4%.
Table 5: Party Spending Categories, 2024
Super Bowl Commercials
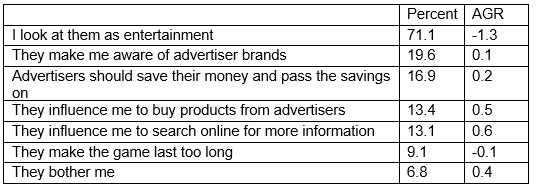
As indicated in Table 2, the relative importance of Super Bowl commercials has declined over the nine years. Table 6 shows a decline in the entertainment value of Super Bowl commercials, although the proportion is still high at 71.1%. The proportion that says “advertisers should save their money” is increasing, as well as “they bother me.”
Table 6: Super Bowl Commercials, 2024
Super Bowl Watching and Purchase Behavior
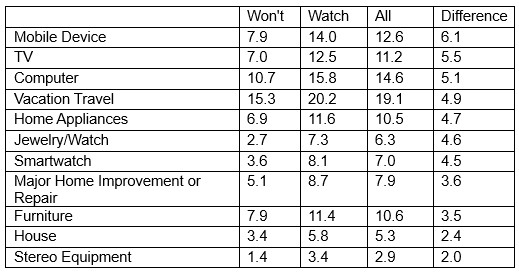
Respondents were asked if they are planning any major purchases within the next six months, which is compared to those planning to watch the Super Bowl in Table 7. A difference proportion is calculated by subtracting those who won’t watch from those who say they will watch. The biggest difference is in a mobile device with an advantage of nearly double over the won’t watchers. Planning to watch the Super Bowl shows a dramatic increase in every category.
Table 7: Purchase Plans in the Next 6 Months, 2024
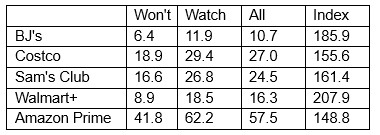
Another way of assessing the impact of Super Bowl watching is to consider retail club memberships. Table 8 shows that the Super Bowl watchers index is higher than all the common clubs. Amazon Prime and Costco, for example, index at almost 1.5 times.
Table 8: Retail Club Membership by Super Bowl Watching
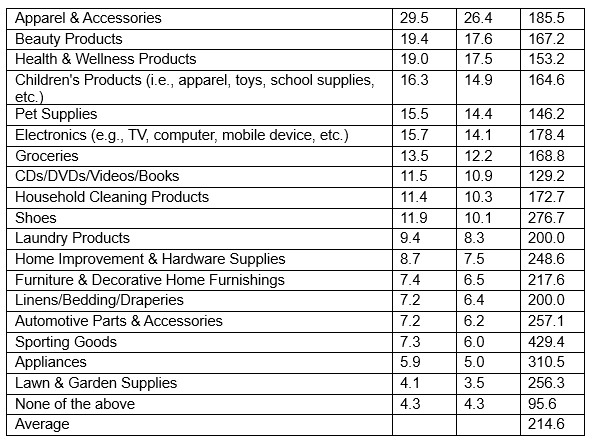
Because Amazon Prime is the leading retail club in terms of market penetration, considering member purchase behavior in the last 30 days also provides additional insight. Across the 18 categories in Table 9, the average index (214.6) is more than twice that for Super Bowl watchers—those making no purchases index lower at 95.6. More frequently purchased products, such as groceries and pet supplies, are indexed somewhat lower than less frequently purchased products, such as appliances and sporting goods. Certainly, the Super Bowl watcher should be of great interest to the marketer.
Table 9: Amazon Prime Purchase Within Last 30 Days by Super Bowl Watching
Happiness
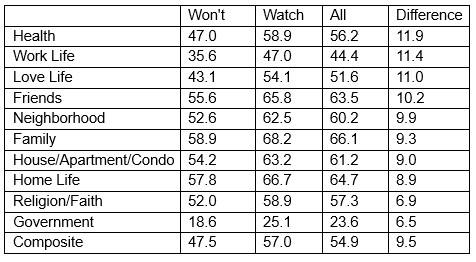
Respondents are asked to rate their overall happiness across ten categories on a five-point scale. Shown in Table 10 is the proportion for the combination of happy and totally happy. The unmistakable conclusion is that those who plan to watch the Super Bowl are happier than those who do not consider the composite average. Perhaps it has something to do with integrating into the culture, which may be related to work life, love life, and friends. It is interesting also that Super Bowl watchers are happier with their health. Relatively stable categories, such as religion and government, show smaller differences.
Table 10: Happiness by Super Bowl Watching
Summary
The Super Bowl has become a cultural event that ranks with Father’s Day and Halloween. Planning to watch the Super Bowl has decreased over the last nine years but has increased in the previous two years. The game itself is less than half of the importance to the viewer, with parties, commercials, and the halftime show accounting for the rest. Gender, age, and income are the strongest predictors of planning to watch. Watchers also plan to buy more big-ticket things and have bought more in all categories than those who do not watch. Super Bowl watchers are also happier than those who don’t plan to watch.