Executive Summary
Valentine’s Day remains a meaningful but evolving consumer holiday, shaped by long-term declines in participation alongside steady and increasingly targeted spending. Findings from the January 2026 Prosper Insights & Analytics survey conducted in cooperation with the National Retail Federation (n=7,791) show that just over half of U.S. adults plan to celebrate Valentine’s Day, with spending concentrated primarily on significant others and close family. While fewer consumers are participating overall, those who do celebrate continue to invest in traditional gifts such as candy, flowers, jewelry, and experiences, reinforcing Valentine’s Day’s ongoing relevance as a retail and relationship-driven occasion.
- 54.6% of U.S. adults plan to celebrate Valentine’s Day in 2026, consistent with the long-term average but slightly lower than 2025
- Valentine’s Day participation has declined by an average of 0.29% annually over the past 15 years
- The primary motivation for celebrating is a significant other or partner (50.0%), followed by viewing the holiday as a fun activity with friends or family (41.7%)
- 60.7% of celebrators begin planning in February, with 41.8% planning during the week leading up to Valentine’s Day
- Online shopping is the leading purchase channel (38.2%), followed closely by department stores (35.2%) and discount stores (29.6%)
Valentine’s Day Beyond Cards and Candy
By Dr. Martin Block, Professor Emeritus, Northwestern University, Retail Analytics Council
Valentine’s Day has become a popular American seasonal holiday and part of the culture. Valentine’s Day celebration is among the topics covered by Prosper Insights & Analytics in cooperation with the National Retail Federation (NRF), which conducts a monthly online survey that collects data about annual events and related market behavior. Do you celebrate Valentine’s Day was asked in the January 2026 survey (n=7,791). In response to the question, 54.6% reported yes.
Table 1: Seasonal Holiday Participation
| Month | Holiday | Percent |
| January | Super Bowl | 79.9 |
| February | St. Patrick’s Day | 61.9 |
| Valentines Day | 54.6 | |
| Easter | Celebrate Easter | 80.7 |
| May | Mother’s Day | 84.2 |
| June | Father’s Day | 75.4 |
| Graduation | 33.6 | |
| July | 4th of July | 87.2 |
| Back to School | 40.1 | |
| October | Halloween | 72.4 |
| November | Thanksgiving Shopping | 74.3 |
| December | Winter Holidays | 92.8 |
| Christmas | 85.3 |
Recent Valentine’s Day History
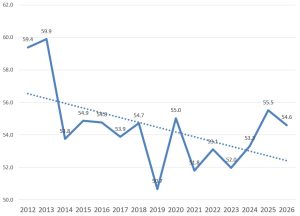
Overall, the rate of anticipated celebrating Valentine’s Day has decreased by .29% per year over the last 15 years, as shown in Figure 1, with an overall average of 54.6%. The current year, 2026, has a slight decrease from 2025.
Figure 1: Celebrating Valentine’s Day
Valentine’s Day Planning
The most important reason for celebrating Valentine’s Day is the significant other or partner, as shown in Table 2. This is followed by a fun thing to do. It is interesting that 10.5% say that it is expected of me.
Table 2: Reasons to Celebrate Valentine’s Day
| Percent | |
| It’s important to my significant other / partner | 50.0 |
| It’s a fun thing to do with friends and family | 41.7 |
| Valentine’s Day is one of my favorite holidays | 23.7 |
| It’s expected of me | 10.5 |
About three out of five (60.7%) say they start planning in February as shown in Table 3. The remainder plans in January or earlier.
Table 3: When Do You Start Planning
| Percent | |
| December or earlier | 4.8 |
| January | 29.0 |
| The first week of February / the week before Valentine’s Day | 41.8 |
| The week of Valentine’s Day | 18.9 |
| On Valentine’s Day | 5.5 |
The leading purchase location is online as shown in Table 4. It is noteworthy that some respondents indicate more than one location.
Table 4: Where Will You Purchase
| Percent | |
| Online | 38.2 |
| Department Store | 35.2 |
| Discount Store | 29.6 |
| Specialty Store (Greeting Card/Gift Store, Electronics Store) | 20.9 |
| Florist | 18.8 |
| Local/Small Business | 18.5 |
| Jewelry Store | 14.7 |
| Specialty Clothing Store | 14.2 |
| Catalog | 2.2 |
| Other | 7.6 |
The majority of celebrators expect to pay the same for their Valentine’s Day purchases (65.4%), whereas about a fourth expect to pay higher prices (25.3%). The concern over higher prices has decreased since 2025.
Celebrator Characteristics
Celebrators vary by their marital status, age, children in the household, and income. A classification regression tree (CRT) shows that the presence of children is the most important discriminating variable. The importance of independent variables is shown in Table 5. Being married is the second most important.
Figure 2 shows the tree. The node with the highest celebration rate is married under 36 with children. The node with the lowest celebration rate is unmarried, has no children, and has an income below $36,000.
Figure 2: Classification Tree Predicting Valentine’s Day Celebration
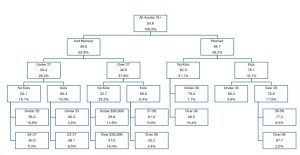
Table 5: Variable Importance
| Independent Variable | Importance | Normalized Importance |
| Children | 0.012 | 100.0% |
| Married | 0.011 | 93.0% |
| Age | 0.010 | 85.0% |
| Income | 0.006 | 47.7% |
Spending by Person
Table 6 shows the planned spending by person, including significant other, other family, friends, children’s classmates or teacher, co-workers, pets and others. Overwhelmingly, the significant other is the person Valentine’s Day gifts are purchased for. It is also the leading spending amount with an average of $119.60 and with purchases for is slightly decreasing at 0.35% over the last 20 years. Just over a third (35.4%) buy for a pet and spend $40.55. Co-workers interestingly are purchased for by 20.9% and are increasing. The combined average spend is $199.78. This translates to an estimated $29.1 billion.
Table 6: Planned Spend by Person
| Significant Other/
Spouse |
Other Family Members | Friends | Children’s Classmates/
Teachers |
Co-workers | Pets | Other | |
| Percent buying for | 83.2 | 57.6 | 33.5 | 27.2 | 20.9 | 35.4 | 16.9 |
| Average Spend Among Buyers | 119.60 | 53.45 | 48.89 | 55.33 | 56.52 | 40.55 | 69.95 |
| Annual Growth Rate
(20 years) |
-0.31 | -0.29 | 0.37 | 0.37 | 0.44 | 0.96 | 0.36 |
| AGR as Percent | -0.34 | -0.52 | 1.80 | 1.74 | 3.30 | 4.14 | 3.75 |
Spending by Item
Table 7 shows the planned gifts by item. Candy leads the way, followed by flowers and greeting cards. Candy and gift cards are both increasing over the last eleven years, while greeting cards are decreasing. The most expensive items are jewelry at an average of $193.04 given by a reported 24.8%. Clothing and an evening out are also significant expenses.
Table 7: Planned Gifts
| Percent | AGR | Amount | |
| Candy | 55.9 | 0.58 | 31.87 |
| Flowers | 41.1 | 0.25 | 52.21 |
| Greeting Cards | 41.3 | -1.02 | 24.67 |
| An evening out | 38.9 | -0.02 | 111.28 |
| Jewelry | 24.8 | 0.34 | 193.04 |
| Clothing | 22.0 | 0.49 | 109.74 |
| Gift card/gift certificate | 20.6 | 0.60 | 82.38 |
Summary
Valentine’s Day celebrations have declined over the last 12 years, but increased slightly in 2025. Spending is slightly more oriented to the significant other and the family. Candy, flowers, jewelry and clothing and gift cards are all increasing as gift items.