Executive Summary
Easter falls between the Super Bowl and Mother’s Day in terms of popularity among American celebrations. Over the past eight years, there has been a slight decrease in the observance of Easter, along with a minor dip in associated spending. Factors such as the presence of children, age, and income strongly influence individuals’ likelihood of participating in Easter celebrations. Notably, Easter celebrants demonstrate a tendency to engage in increased purchasing and shopping activities, particularly favoring online transactions. Additionally, those planning to celebrate Easter generally report higher levels of happiness compared to non-participants.
- Easter is the second most popular religious holiday in America, with 79.5% of adults planning to celebrate it in 2026.
- Celebratory activities include cooking a holiday meal, visiting family and friends, attending church, and participating in Easter egg hunts.
- Planned spending on Easter-related items has increased across categories, despite a slight overall decrease in spending since 2023.
- Discount stores are the primary destination for Easter spending, followed by department stores and online retailers.
- Characteristics such as the presence of children, age, and income strongly influence the likelihood of celebrating Easter.
- Easter celebrators plan to spend more and shop more frequently, with a preference for online shopping.
- Those who plan to celebrate Easter report higher levels of happiness across various aspects of life compared to non-celebrators.
Retail Trends, Spending, and Easter Celebratory Patterns
By Dr. Martin Block, Professor Emeritus, Northwestern University, Retail Analytics Council
Easter is the second most popular religious holiday in America. Celebrating Easter is among the topics covered by Prosper Insights & Analytics in the monthly online surveys that collect data about annual events and related market behavior sponsored by the National Retail Federation. Celebrating Easter was asked in the March 2026 survey (n=7,845). In response to the question, “Will you celebrate Easter this year?” 79.5% of all adults said yes. As shown in Table 1, Easter ranks between Mother’s Day and the Super Bowl.
Table 1: Seasonal Holiday Participation
| Percent | |
| 4th of July | 87.2 |
| Christmas | 85.3 |
| Mother’s Day | 84.2 |
| Celebrate Easter | 79.5 |
| Super Bowl | 79.9 |
| Father’s Day | 75.3 |
| Halloween | 72.4 |
| St. Patrick’s Day | 60.4 |
| Valentines Day | 54.6 |
Recent Easter Celebration History
The Easter celebration rate has decreased slightly over the past fifteen years, as shown in Figure 1. The rate dropped sharply in 2021, no doubt related to COVID-19, and has a slight decrease at -0.16% per year.
Figure 1: Celebrate Easter Trends
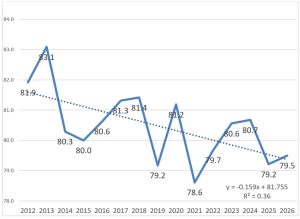
Table 2 shows plans for celebrating Easter. Cooking a holiday meal is the leading activity, followed by visiting family and friends and going to church. An Easter egg hunt is planned for about one out of three.
Table 2: Celebration Plans
| Percent | |
| Cook holiday meal | 55.6 |
| Visit family and friends | 51.5 |
| Go to church | 43.1 |
| Plan an Easter egg hunt | 35.6 |
| Watch TV | 33.7 |
| Browse the web | 18.9 |
| Open gifts | 18.7 |
| Shop in a store | 15.9 |
| Shop online | 14.8 |
| Work | 2.3 |
| Nothing | 2.5 |
Flowers, cards, decorations, and clothing dominate spending plans among those celebrating Easter, as shown in Table 3. Almost every planned category shows an increase in spending, except for the higher cost items such as clothing and food. Overall, the combined average spend is $195.59, representing an estimated 24.91% of the US economy.
Table 3: Planned Easter Spending Dollars Among Buyers
| 2025 | 2026 | Change | Percent | |
| Flowers | 35.31 | 37.02 | 1.71 | 46.1 |
| Cards | 19.62 | 21.61 | 1.99 | 46.3 |
| Decorations | 26.58 | 27.82 | 1.25 | 52.8 |
| Clothing | 58.05 | 57.22 | -0.83 | 50.9 |
| Gifts | 47.37 | 48.00 | 0.63 | 63.9 |
| Food | 66.74 | 65.34 | -1.40 | 89.6 |
| Candy | 29.14 | 30.01 | 0.87 | 92.1 |
| Other | 30.51 | 30.78 | 0.27 | 25.5 |
| Combined | 189.26 | 195.59 | 6.33 |
Those planning to celebrate Easter also indicated what inspires them when they shop for Easter-related items is led by tradition. Table 4 indicates tradition is the most important followed by sales or promotions and by social activity. Store displays and decorations are also important.
Table 4: Easter-related Purchase Inspiration
| Tradition | 58.3 |
| Sales or promotions | 35.8 |
| It’s a social activity with family or friends | 29.9 |
| Store displays and decorations | 27.0 |
| Exclusive or seasonal products | 26.7 |
| Retailer or brand events | 14.4 |
| Other | 1.2 |
| None of the above | 6.6 |
As shown in Table 5, the largest category of planned spending will be in a discount store, followed by a department store and online. Based on a 20-year history, annual growth rates are also shown. Most categories show a decline, except online, which shows an average 1.46% yearly increase. Department stores and specialty clothing stores show a slight increase.
Table 5: Where Will Easter Spend Occur
| Percent | AGR | |
| Discount Store | 54.6 | -0.71 |
| Department Store | 41.6 | 0.35 |
| Online | 33.5 | 1.46 |
| Local/Small Business | 22.6 | -0.15 |
| Specialty Store (Greeting Card/Gift Store, Florist, Jewelry) | 21.8 | -0.17 |
| Specialty Clothing Store | 14.2 | 0.33 |
| Catalog | 1.9 | -0.12 |
Easter Celebrators
A classification regression tree (CRT) is a reasonable way to determine some of the characteristics of the Easter celebrator. Using the overall proportion of 79.5%, gender, generation (age), income, marital status and the presence of children are used to estimate the relative proportion. Figure 2 shows the first split by the presence of children; the number of non-children celebrators dropped to 75.5%. The percentages in the nodes indicate the proportion of the total adult sample and children increases to 88.4%. The highest node is having children, income over $37,000, and millennial, with a rate of 93.8% representing 9.2% of the total sample. The lowest node shown is no children, millennial and older, with an income of under $25,000, showing 70.0 and representing only 14.4% of the total sample. The relative importances of the predictor variables in order are presence of children, generation (age), income, marital status and female.
Figure 2: Easter Celebrators Segmentation Tree
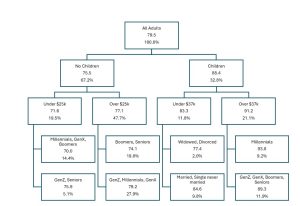
Table 6 shows that 22.3% plan to spend more, compared to 15.6% planning to spend less The majority, 62.3% say they plan to spend the same.
Table 6: Spending Plans Compared to Last Year
| More | 22.3 |
| Same | 62.2 |
| Less | 15.6 |
Happiness
Respondents are asked to rate their overall happiness across ten categories on a five-point scale. Table 9 shows the proportion of the combination of happy and totally happy. The unmistakable conclusion is that those who plan to celebrate Easter are happier than those who do not, as shown in the composite average. The biggest differences are in religion, love life, work life, and especially government.
Table 7: Happiness by Easter Celebration
| Yes | No | Total | Index | |
| Religion | 60.3 | 42.6 | 56.7 | 106.3 |
| Love Life | 54.2 | 42.4 | 51.8 | 104.6 |
| Work Life | 45.3 | 30.9 | 42.4 | 106.8 |
| Government | 30.7 | 17.7 | 28.1 | 109.3 |
| Family | 66.5 | 54.1 | 64.0 | 103.9 |
| Health | 58.2 | 47.6 | 56.0 | 103.9 |
| Neighborhood | 60.4 | 50.3 | 58.3 | 103.6 |
| Friends | 63.6 | 52.1 | 61.2 | 103.9 |
| House | 61.4 | 52.0 | 59.5 | 103.2 |
| Home | 65.0 | 55.0 | 62.9 | 103.3 |
| Composite | 56.6 | 44.5 | 54.1 | 104.5 |
Summary
Easter ranks between the Super Bowl and Mother’s Day. Celebrating the day has decreased slightly in the last eight years. Spending is also down slightly. The presence of children, age, and income are the strongest predictors of planning to celebrate. Celebrators plan to buy more and shop more. They are also more likely to shop online. Easter celebrators are also happier than those who don’t plan to celebrate.