
Executive Summary
Based on a survey of 7,914 consumers conducted by Prosper Insights & Analytics in cooperation with the National Retail Federation, Father’s Day remains one of America’s most celebrated holidays, with spending and participation continuing to grow.
- 76.8% of Americans plan to celebrate Father’s Day in 2026, making it the nation’s sixth most popular holiday, ranking just behind the Super Bowl (76.9%) and ahead of Halloween (73.1%).
- Average planned spending is $226.58 per celebrator, up $36.77 from 2025’s average of $189.81, representing a nearly 20% year-over-year increase.
- Father’s Day is expected to generate approximately $27.9 billion in economic activity, compared to $34.1 billion for Mother’s Day.
- Households with children are the most likely to celebrate Father’s Day, indexing 17.5% above average. Millennials and Gen Z are also more likely to participate than older generations.
- Consumers prioritize finding a gift that is unique or different (44.1%) and one that creates a special memory (34.3%), while only 21.8% cite cost-effectiveness as a primary consideration.
- Greeting cards (60.0%), clothing (58.2%) and special outings (53.1%) are the most frequently purchased Father’s Day gifts. Consumer electronics command the highest average spend at $79.88 per purchaser.
Father’s Day Spending Soars as Consumers Seek More Meaningful Ways to Celebrate
By Dr. Martin Block, Professor Emeritus, Northwestern University, Retail Analytics Council
Celebrating Father’s Day (June 21,2026) is among the topics covered by Prosper Insights & Analytics in its monthly online surveys, which collect data on annual events and related market behavior. This research was conducted by Prosper Insights & Analytics in cooperation with the National Retail Federation.
Celebrating Father’s Day was asked in the May 2026 survey (n=7,914). In response to the question, “Do you expect to spend more, the same, or less for Father’s Day than you spent last year?” Of the total, 23.2% said they don’t celebrate Father’s Day, leaving 76.8% who do. As shown in Table 1.
Table 1. Seasonal Holiday Participation.
| Percent | |
| Christmas | 93.4 |
| 4th of July | 87.2 |
| Mother’s Day | 84.2 |
| Celebrate Easter | 80.7 |
| Super Bowl | 76.9 |
| Father’s Day | 76.8 |
| Halloween | 73.1 |
| St. Patrick’s Day | 61.9 |
| Valentines Day | 52.0 |
| Graduation | 35.9 |
Recent Father’s Day Celebration History
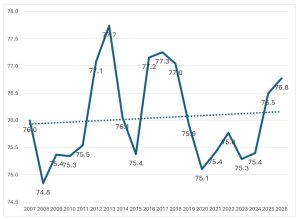
The Father’s Day celebration rate has remained relatively flat for the last, especially for the last twenty years, as shown in Figure 1. The rate dropped slightly in 2021, likely due to COVID-19. It increased slightly in 2025 and 2026.
Figure 1. Celebrate Father’s Day Trends
Celebrating Father’s Day is more complicated because it can involve different people. Table 2 shows that the most common recipient is a father or stepfather, at 47.6%. This is followed by a husband, at 25.4%. The base is the total sample.
Table 2. Father’s Day Recipients
| Percent | |
| Father or Stepfather | 45.2 |
| Husband | 25.3 |
| Son | 13.1 |
| Brother | 10.0 |
| Friend | 8.3 |
| Other relative | 7.0 |
| Grandfather | 7.3 |
| Godfather | 2.5 |
The overall average planned spend for Father’s Day was $226.58. As shown in Table 3. This compares to the $288.25 reported for Mother’s Day last month. Mother’s Day represents $34.1 billion to the U.S. economy. Father’s Day represents another $27.9 billion.
The leading categories purchased are greeting cards, clothing, and a special outing. The categories in Table 3 are ranked by purchase frequency. Most categories, except greeting cards, special outings, consumer electronics, and automotive accessories, have increased over the last year. The sharpest decline is in special outings. The overall average planned spend is $36.77 more than in 2025.
Table 3. Planned Father’s Day Buying.
| 2026% | Spend Amount
2026 |
Spend Amount 2025 | Year over Year | |
| Greeting Cards | 60.0 | 14.50 | 13.45 | -1.05 |
| Clothing | 58.2 | 57.67 | 56.22 | 1.44 |
| Special Outing | 53.1 | 70.46 | 75.42 | -4.96 |
| Gift Certificates | 51.6 | 52.10 | 50.63 | 1.47 |
| Personal Care | 39.9 | 47.15 | 44.91 | 2.24 |
| Tools or Automotive | 30.5 | 52.10 | 51.03 | 1.07 |
| Consumer Electronics | 31.6 | 79.88 | 82.61 | -2.73 |
| Books or CDs | 34.2 | 28.61 | 26.41 | 2.20 |
| Automotive Accessories | 29.8 | 41.33 | 43.06 | -1.73 |
| Home Improvement | 29.1 | 55.49 | 54.18 | 1.31 |
| Sporting Goods | 29.3 | 50.54 | 49.29 | 1.25 |
| Other | 26.0 | 21.65 | 21.77 | -0.12 |
| Total Average Spend | 76.8 | 226.58 | 189.81 | 36.77 |
Where celebrators are spending their money is also changing. Table 4 shows that online is still the leading source for gift purchases, at just over 37%, but it has declined sharply since 2025. Discount stores and specialty clothing stores have increased since 2025.
Table 4. Retail Outlets.
| 2026 | 2025 | Year over Year | |
| Online | 37.8 | 41.1 | -3.3 |
| Department Store | 36.6 | 35.3 | 1.3 |
| Discount Store | 26.4 | 22.7 | 3.7 |
| Specialty Store (Greeting Card/Gift Store) | 22.7 | 21.8 | 0.9 |
| Local/Small Business | 19.2 | 19.1 | 0.1 |
| Specialty Clothing Store | 18.2 | 15.2 | 3.0 |
| Catalog | 2.7 | 1.9 | 0.8 |
About one-third say they look to the retailer for gift inspiration, as shown in Table 5. Another third say they look sometimes. This represents a substantial opportunity for the retailer.
Table 5. Look to Retailers for Gift Inspiration.
| Percent | |
| Always | 14.0 |
| Very often | 20.9 |
| Sometimes | 32.6 |
| Not very often | 14.6 |
| Never | 18.0 |
Table 6 shows what is important to celebrators when purchasing Father’s Day gifts. At 44%, the leading reason is finding a unique or different gift. This is followed by finding a gift that creates a special member at 34%. Convenience and cost-effectiveness are much lower on the list.
Table 6. Importance in Gift Purchasing.
| Percent | |
| Finding a gift that’s convenient for me | 27.9 |
| Finding a gift that’s unique or different | 44.1 |
| Finding a gift that’s cheaper or most cost-effective | 21.8 |
| Finding a gift that creates a special memory | 34.3 |
| Other | 8.5 |
Father’s Day Celebrators
Describing who the Father’s Day celebrators are is shown in Table 7. The comparison is made between celebrators and those who don’t. The index is those who say they celebrate. Those who are married and those with children are the most likely, relatively speaking, to celebrate. They show the highest indices. There also appears to be an age-based relationship, with younger segments, particularly Gen Z and millennials, more likely to celebrate. There is also a slight ethnic relationship between African Americans and Hispanics, with indices higher. Celebrators also tend to have higher incomes.
Table 7. Celebrator Demographics.
| Celebrators | Total | Index | |
| Male | 50.3 | 47.9 | 105.0 |
| Female | 49.7 | 52.1 | 95.4 |
| Married | 39.8 | 36.6 | 108.7 |
| Unmarried Partner | 8.4 | 7.7 | 109.1 |
| Divorced or separated | 10.0 | 11.7 | 85.5 |
| Widowed | 3.9 | 5.6 | 69.6 |
| Single, never married | 30.9 | 32.1 | 96.3 |
| Have Children | 45.4 | 38.6 | 117.5 |
| Income ($000) | 64.1 | 62.5 | 102.5 |
| Gen-Z | 23.9 | 21.3 | 112.2 |
| Millennials | 29.4 | 26.0 | 113.1 |
| Gen-X | 27.6 | 27.2 | 101.5 |
| Boomers | 17.9 | 23.4 | 76.5 |
| Seniors | 1.2 | 2.1 | 57.1 |
| Average Age | 46.1 | 48.5 | 94.9 |
| African American | 18.2 | 17.3 | 105.2 |
| Asian | 5.0 | 4.6 | 108.7 |
| Multi-Racial | 1.8 | 1.8 | 100.0 |
| Native American | 1.5 | 1.4 | 107.1 |
| White | 50.4 | 53.6 | 94.0 |
| Hispanic | 18.2 | 16.4 | 111.0 |
Happiness
Respondents are asked to rate their overall happiness across ten categories on a five-point scale. Table 8 shows the proportion of respondents who reported being happy or totally happy on a five-point scale. The unmistakable conclusion is that those who plan to celebrate Father’s Day are happier than those who do not, as shown in the composite average. The biggest differences are in love life, work life, and government, as seen among previous Easter and Mother’s Day celebrators in the last two months.
Table 8. Happiness by Father’s Day Celebration.
| Celebrate | Total | Celebrate Index | |
| Health | 54.0 | 53.1 | 101.6 |
| Family | 61.1 | 60.0 | 101.7 |
| Friends | 57.8 | 57.5 | 100.5 |
| Love Life | 53.3 | 50.0 | 106.6 |
| Home | 60.4 | 59.8 | 101.0 |
| Religion | 55.4 | 54.5 | 101.7 |
| Work Life | 45.4 | 42.6 | 106.5 |
| House | 58.1 | 57.9 | 100.3 |
| Neighborhood | 56.5 | 56.2 | 100.6 |
| Government | 29.6 | 26.5 | 111.7 |
| Composite | 53.2 | 51.8 | 102.6 |
Summary
Father’s Day ranks between the Super Bowl and Halloween. Celebrations of the day have remained almost flat over the last eight years. The presence of children, age, marital status, and income are the strongest predictors of planning to celebrate. Celebrators are shopping mostly online, and spending is up 19% from 2025. The total value of Father’s Day to the U.S. economy is estimated to be nearly $28 billion. Father’s Day celebrators are also happier than those who don’t plan to celebrate.