Executive Summary:
Retail Membership Clubs: Part Two delves deeper into the landscape of retail membership clubs, building upon the analysis presented in Part One. The research incorporates data from the Prosper MBI collected in March and April 2024, shedding light on multiple club memberships, customer motivations, demographics, and the correlation between retail memberships and streaming services.
- Membership Landscape: Amazon Prime, Walmart+, and Costco dominate the retail membership landscape, with traditional store loyalty cards slightly declining.
- Multiple Club Memberships: Nearly 45% of respondents are members of three or more clubs, with various demographic factors influencing membership numbers.
- Demographics: Club members tend to be married, have larger households, and are more likely to be millennials. Certain ethnicities and homeownership status correlate with multiple club memberships.
- Psychological Characteristics: Retail club members exhibit higher levels of happiness and are motivated by emotional and social needs.
- Net Promoter Scores: Retail club memberships positively impact retailer net promoter scores, indicating a higher likelihood of recommendation among club members.
- Streaming Services: There is a significant relationship between retail club memberships and streaming service usage, with Amazon Prime Video leading among paid services and YouTube among free services.
- Correlation: A positive correlation exists between club membership and streaming usage, with higher correlations observed for paid streaming services.
Retail club memberships benefit the specific retailer and contribute to overall consumer satisfaction and engagement in the retail environment.
Retail Membership Clubs: Part Two
By Dr. Martin Block, Professor Emeritus, Northwestern University, Retail Analytics Council
As presented in Retail Membership Clubs: Part One, retailers like Amazon Prime, Walmart+, and Costco have experienced substantial growth, offering consumers exclusive benefits for a membership fee. This second edition adds data from the Prosper MBI collected in March 2024, n=17,869, and the monthly April 2024, n=8,213. In addition, multiple club membership, the importance of customer recommendations, motivations, and the relationship to streaming services will be explored. It will be shown that streaming services are strongly connected to retail memberships, with Amazon Prime and Walmart+ offering them as benefits.
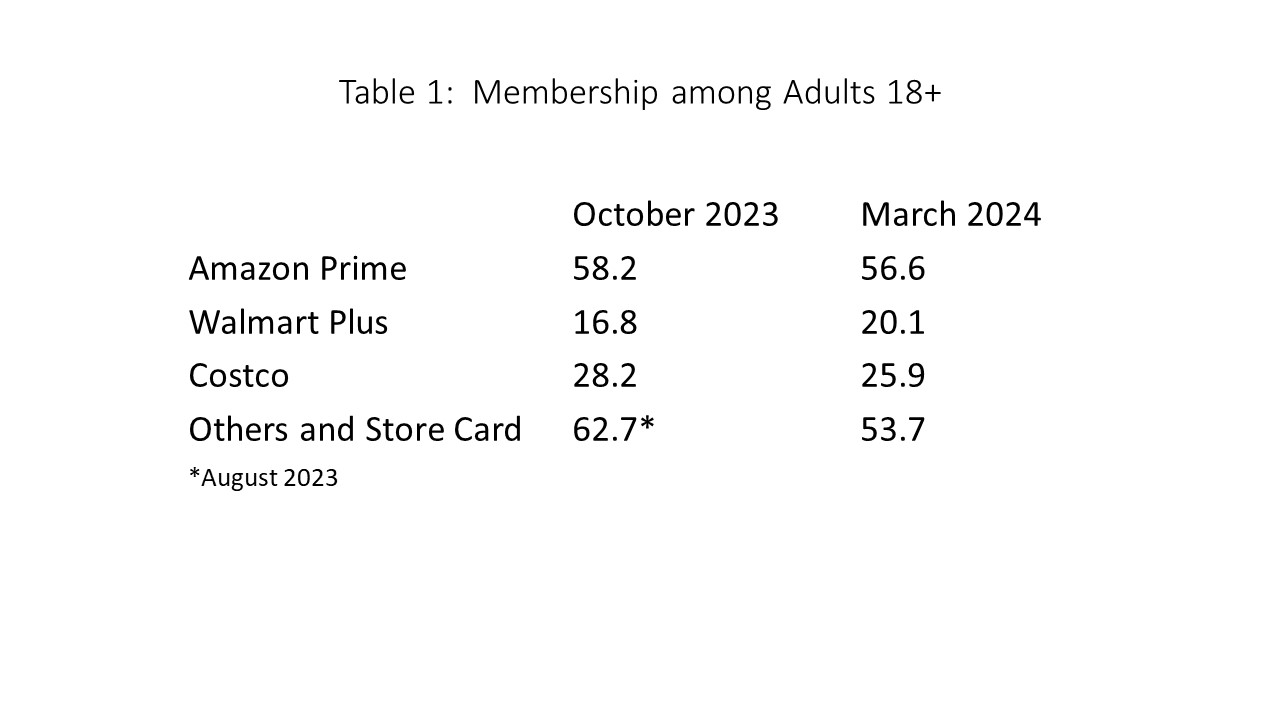
Table 1 shows the retail membership landscape, dominated by Amazon Prime, Walmart+, and Costco. While traditional store loyalty cards and a few other clubs persist, they appear to have slightly declined. The other category includes BJ’s, Sam’s Club, Fresh Pass, and Kroger Boost.
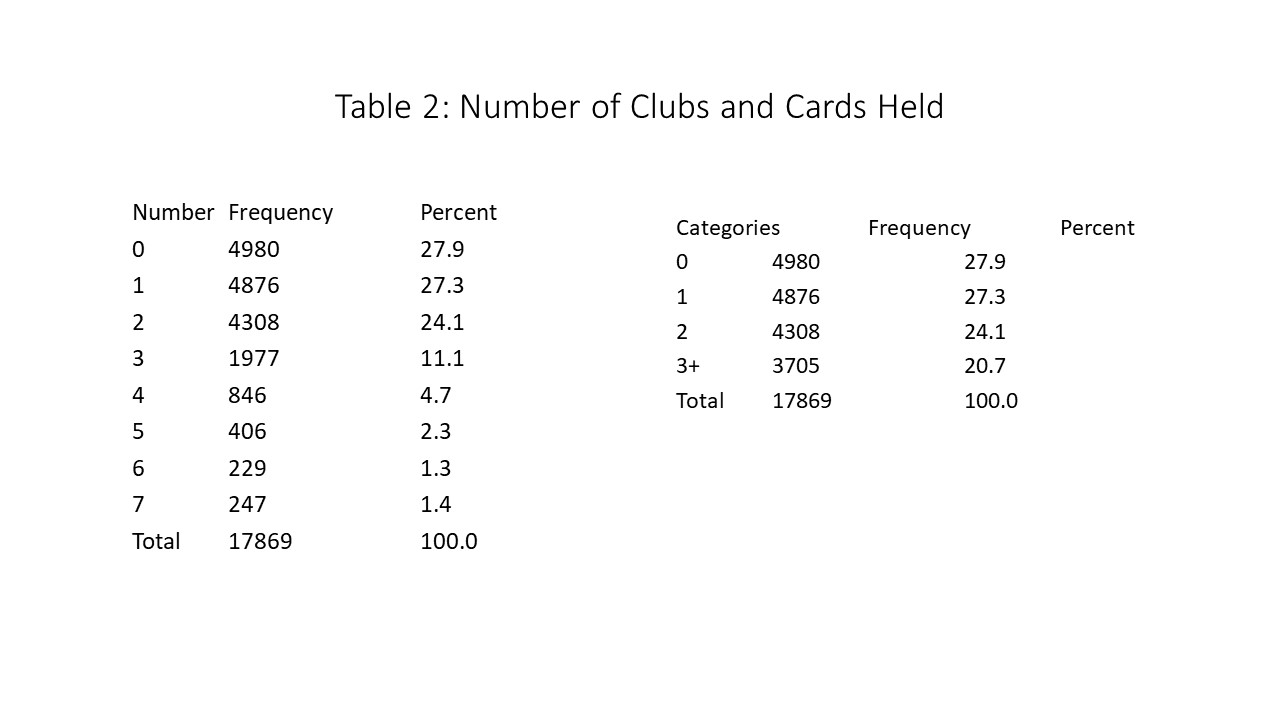
To understand multiple cub memberships, the total selected by each respondent is shown in Table 2. About 28% indicate no retail club memberships, 27% indicate 1, 24% indicate 2, and another 21% indicate three or more. Just over 1% indicate being a member of all seven. For discussion purposes, the three or more are categorized also as shown in Table 2. Interestingly, nearly 45% of the respondents say they are members of three or more clubs.
Demographics of Club Members
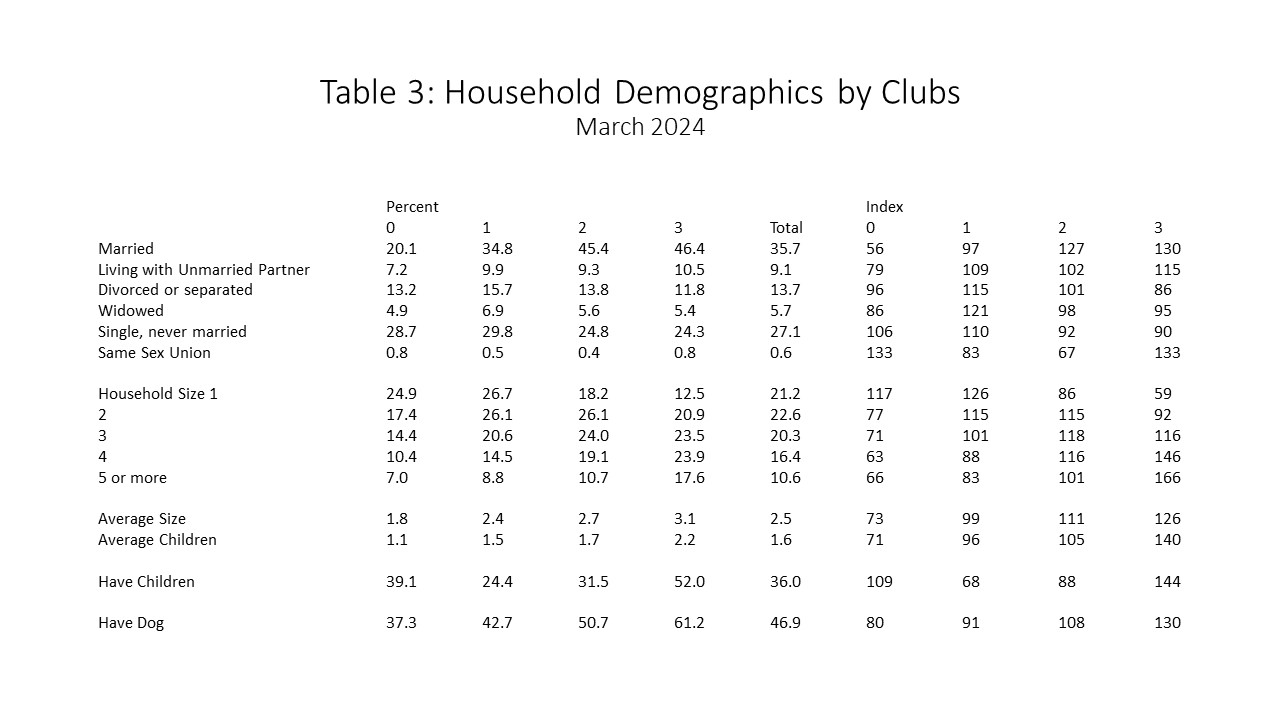
Table 3 shows demographic comparisons among consumers with different numbers of retail memberships. The left columns show the percentage, and the right columns show the index based on the total. One of the biggest differences is being married, and an index of 56 for those with no memberships, 20.1% compared to 35.7%. Being married is among the best predictors, with indices of 127 and 130 among groups with 2 or 3 or more club memberships. There is also a strong relationship with household size, with those reporting four at 146 and 5 or more at 166. Having children in the household is also an important predictor, with an index of 144. Having a dog, which may indicate the nature of the family, indexes at 130.
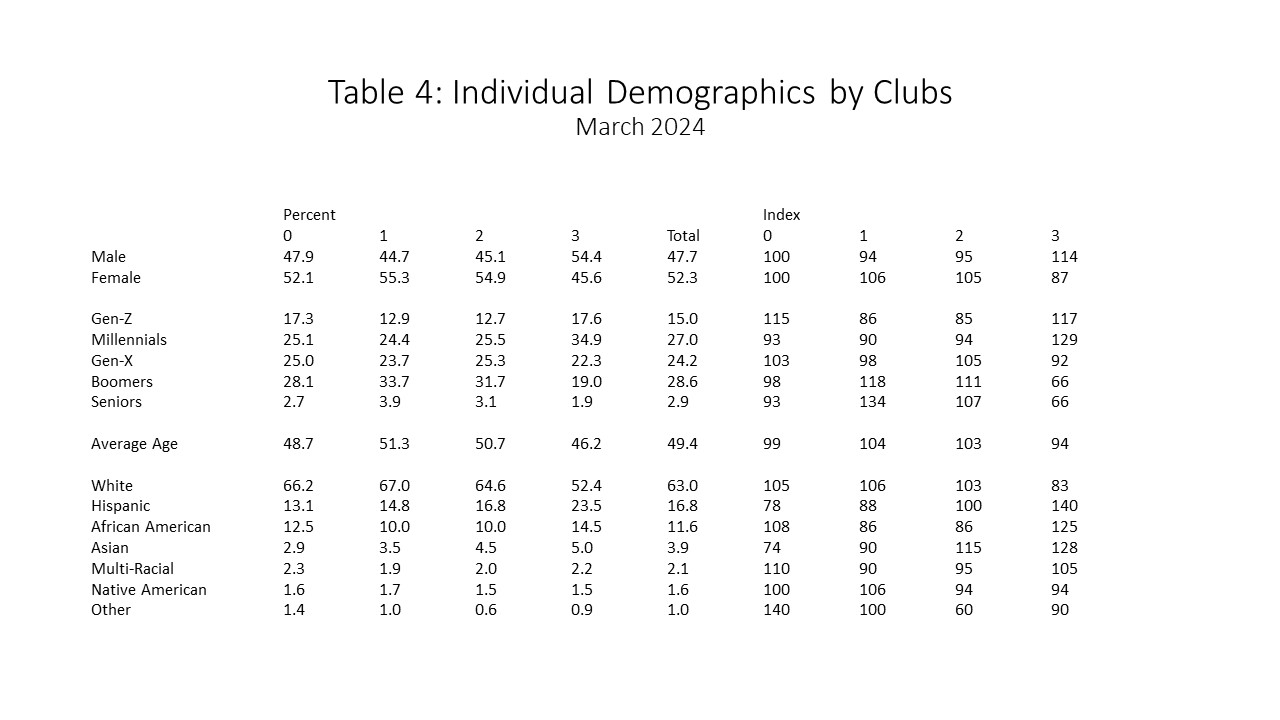
Club members tend to be millennials, as shown in Table 4, with an index of 129. Seniors tend to hold only one retail club membership with an index of 134. Hispanics index high among those with three or more memberships at 140. African Americans and Asians also index well above average.
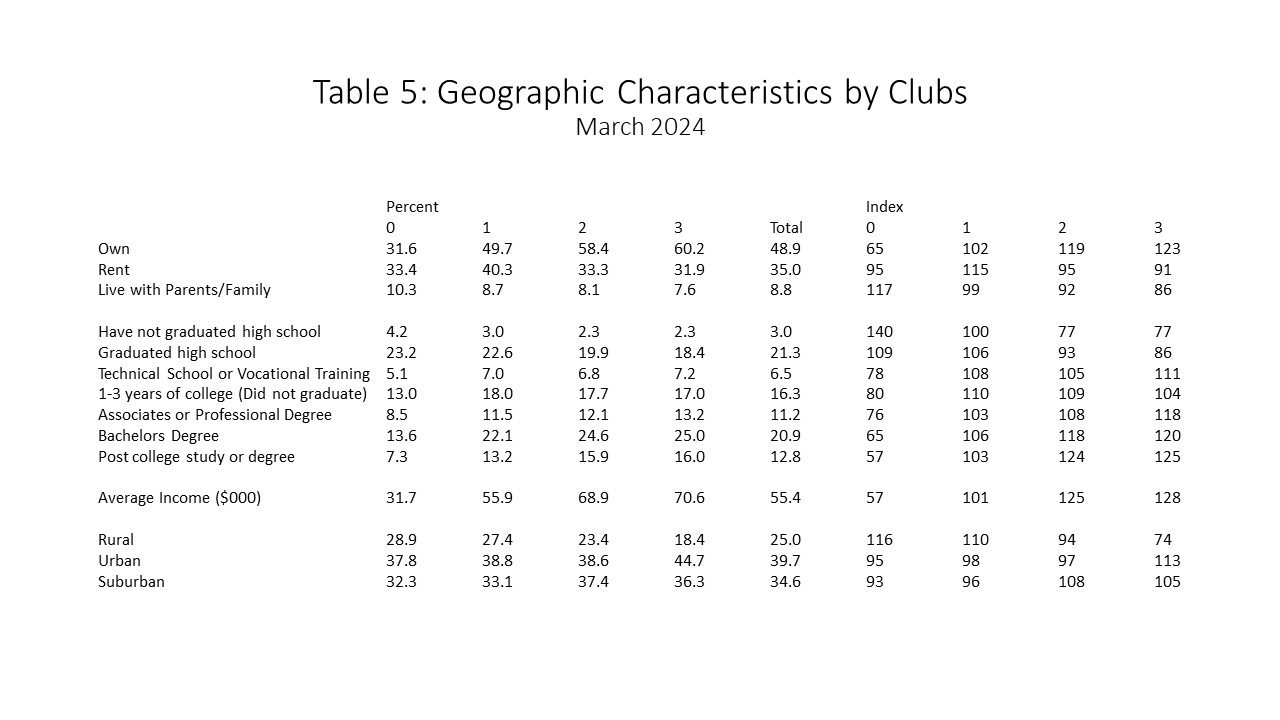
As shown in Table 5, multiple club membership is higher among those who own their own home and slightly higher among those living in an urban zip code. There is a relationship between educational level and multiple club membership, as the index grows to 124 for two clubs and 125 for three or more. The average household income is higher for two and three or more club membership groups.
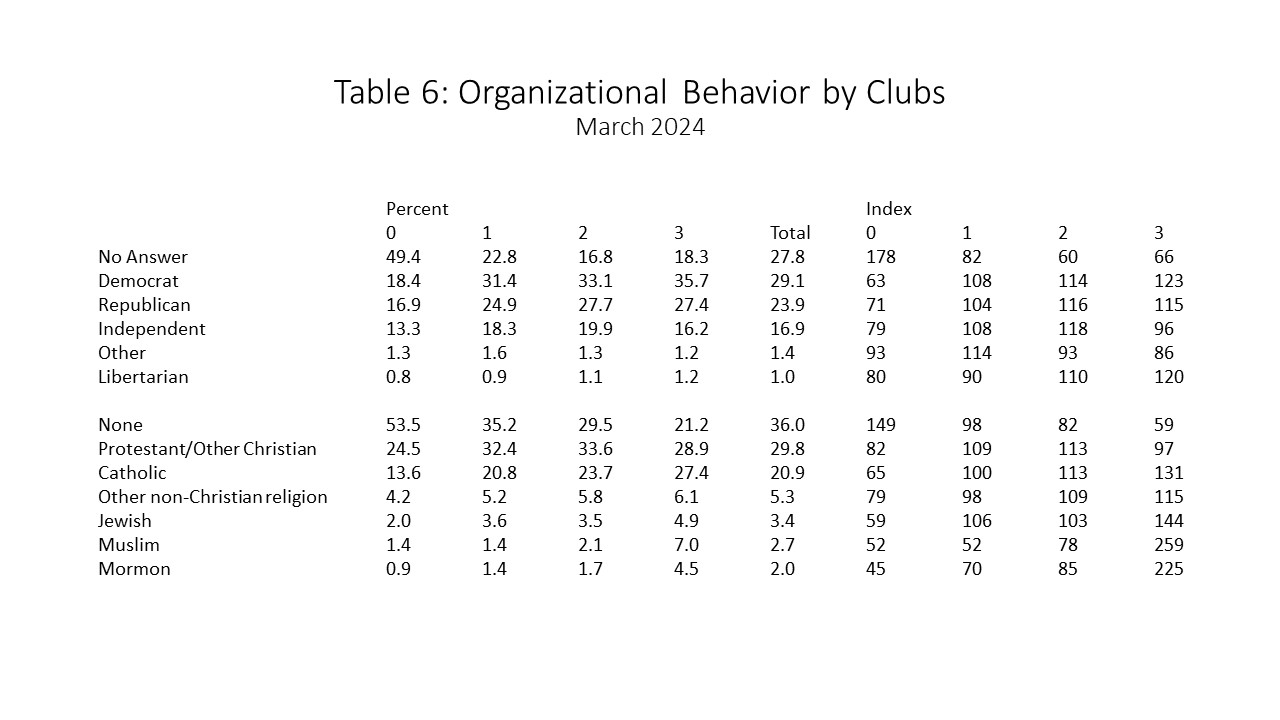
There is a relationship between claiming membership in other groups and retail membership clubs. Those who refuse to answer any political party affiliation index at 178 among those with no retail membership clubs, as shown in Table 6. Religious affiliation shows a similar relationship, with an index of 149. The highest indices are with reporting being Jewish, Mormon, or Muslim; all report much higher rates of three or more retail club memberships. It appears there is a need to belong to something that crosses organizational lines.
Psychological Characteristics
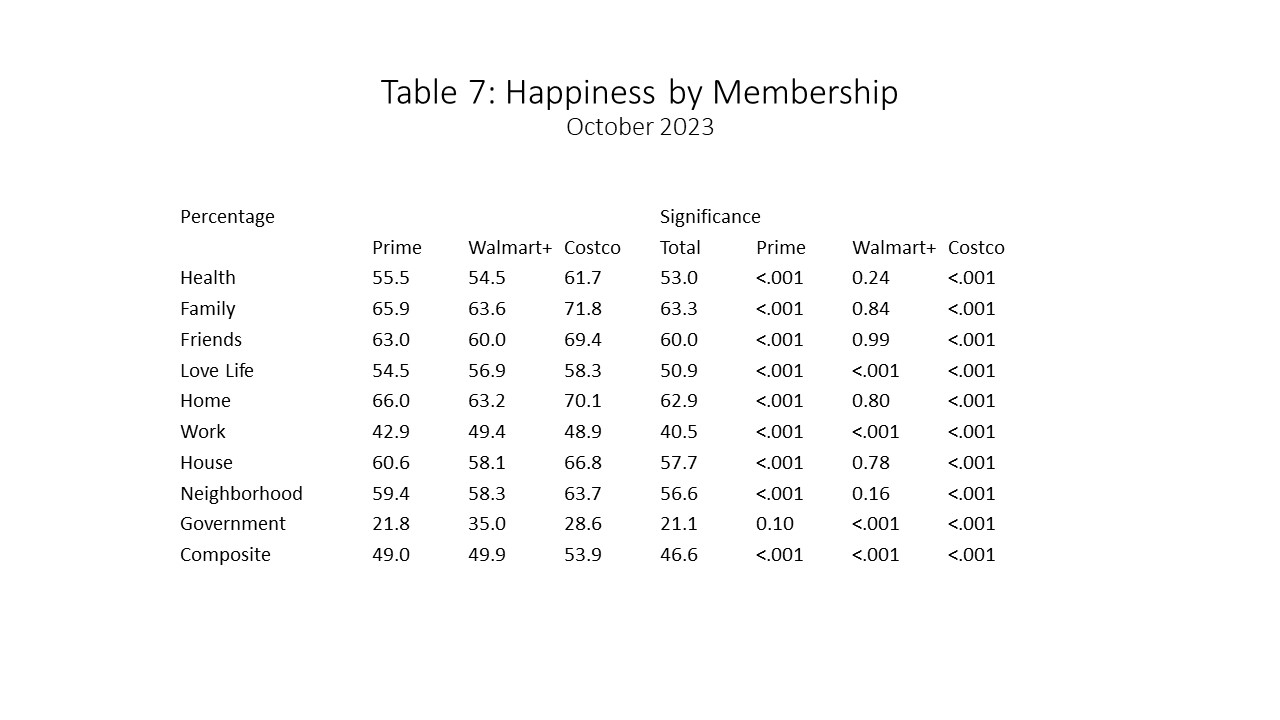
Happiness is measured on a 5-point scale across ten items, as shown in Table 7. The percentages are the sum of very happy and happy. The composite is the average of the ten items. Relative happiness percentages are shown for three clubs: Amazon Prime, Walmart+, and Costco. The statistical significance probabilities of the difference between the happiness among club members and all others are shown on the right. Amazon Prime members are happier across all categories except government. Walmart+ members are happier with their love life, their work life, and government. Costco members are happier across all ten items. Costco members are the happiest based on their composite score, followed by Walmart+ and Amazon Prime. It is reasonable to say that retail club members are happier than others.
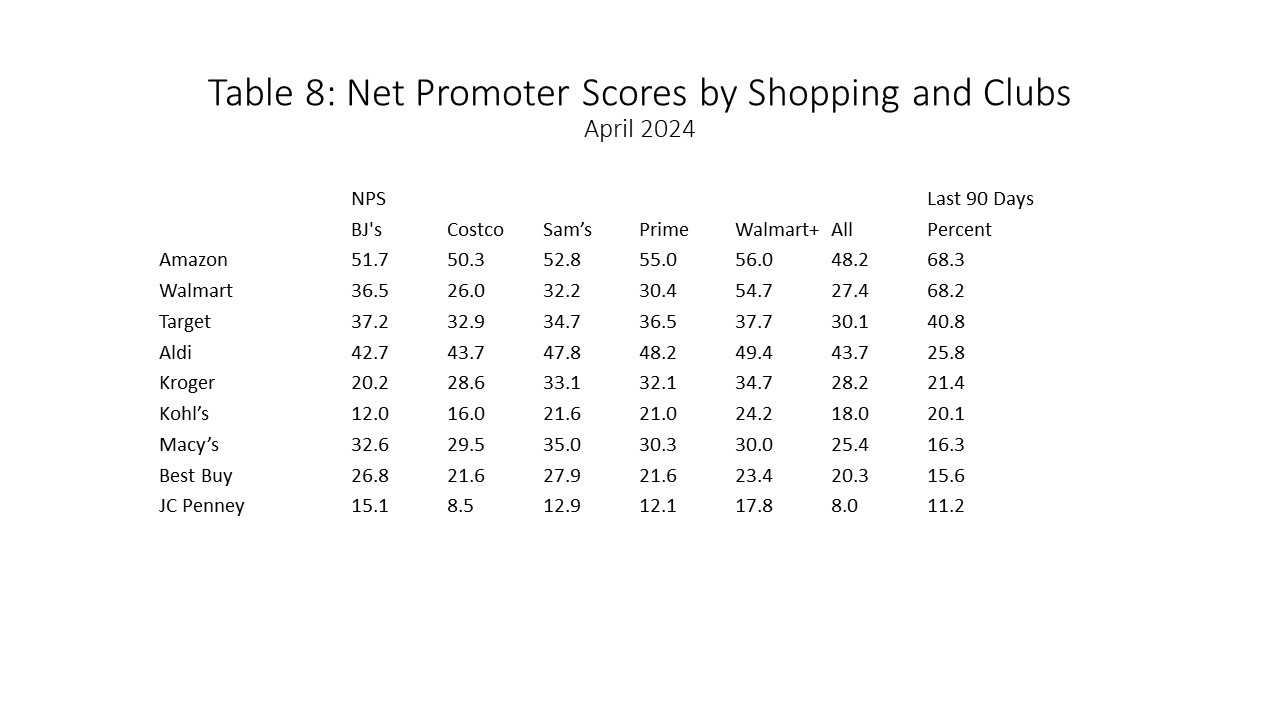
A way to consider how consumers view retailers is the net promoter score. The score is calculated using a ten-point scale based on how likely you are to recommend the retailer to a relative or friend. The net promoter score is then the difference between the top two categories, very likely to recommend, and the bottom six categories minus the two middle categories (7 and 8), which are characterized as indifferent.
Table 8 shows net promoter scores for nine selected retailers measured in April 2024. The retailer needed to be shopped within the last 90 days. Amazon and Walmart+ lead the list, with just over 68% of all adults claiming to have shopped within the last 90 days. Amazon has the highest net promoter score at 48.2%, followed by Aldi at 43.7%. Interestingly, in virtually every case, the net promoter score is higher for each retailer among those holding retail memberships, including those of competitors.
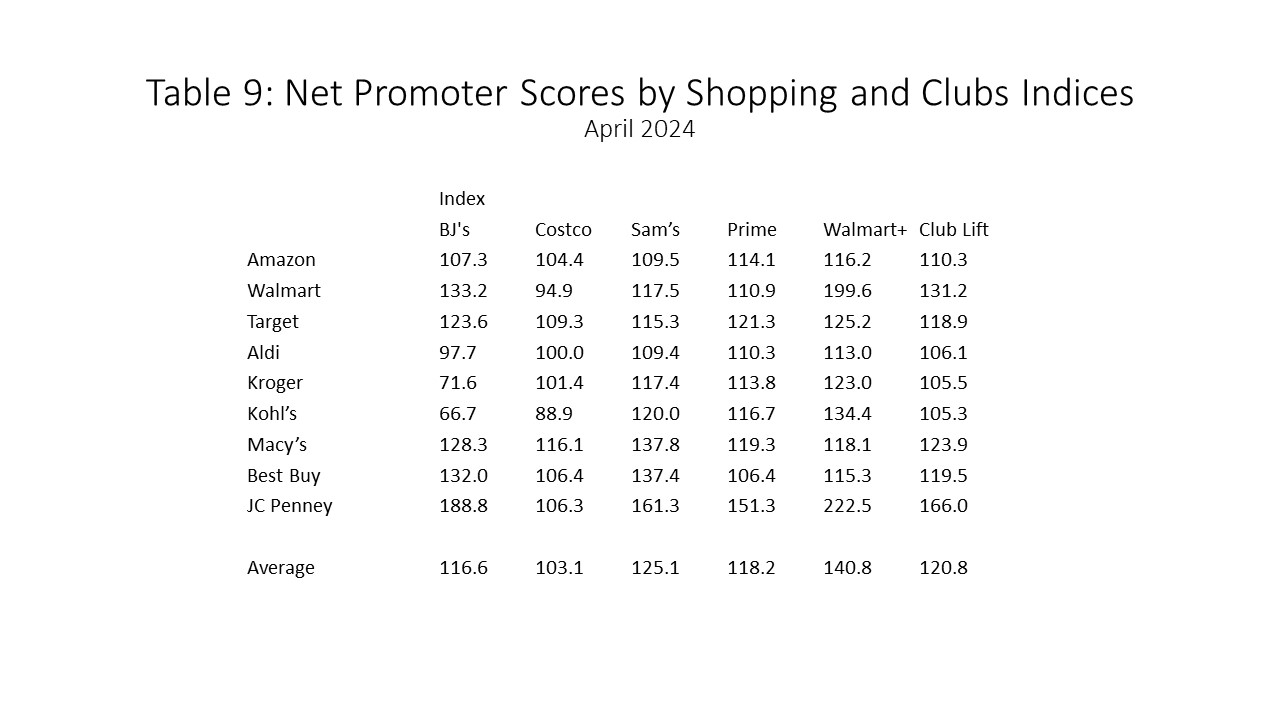
Computing indices is an easy way to see the impact of retail club membership and retailer net promoter scores, as shown in Table 9. There are very few combinations with an index of less than 100. For example, Kohl’s net promoter score is lower among BJ’s members. Averaging the five club indices showed net promoter increases among all nine retailers, with an average of 120.8. The biggest lift is seen for Walmart, Macy’s, and JCPenney. The biggest impact on the clubs seems to be among Walmart+ and Sam’s Club. Retail membership clubs certainly benefit the retailer, but they also benefit the entire retail environment.
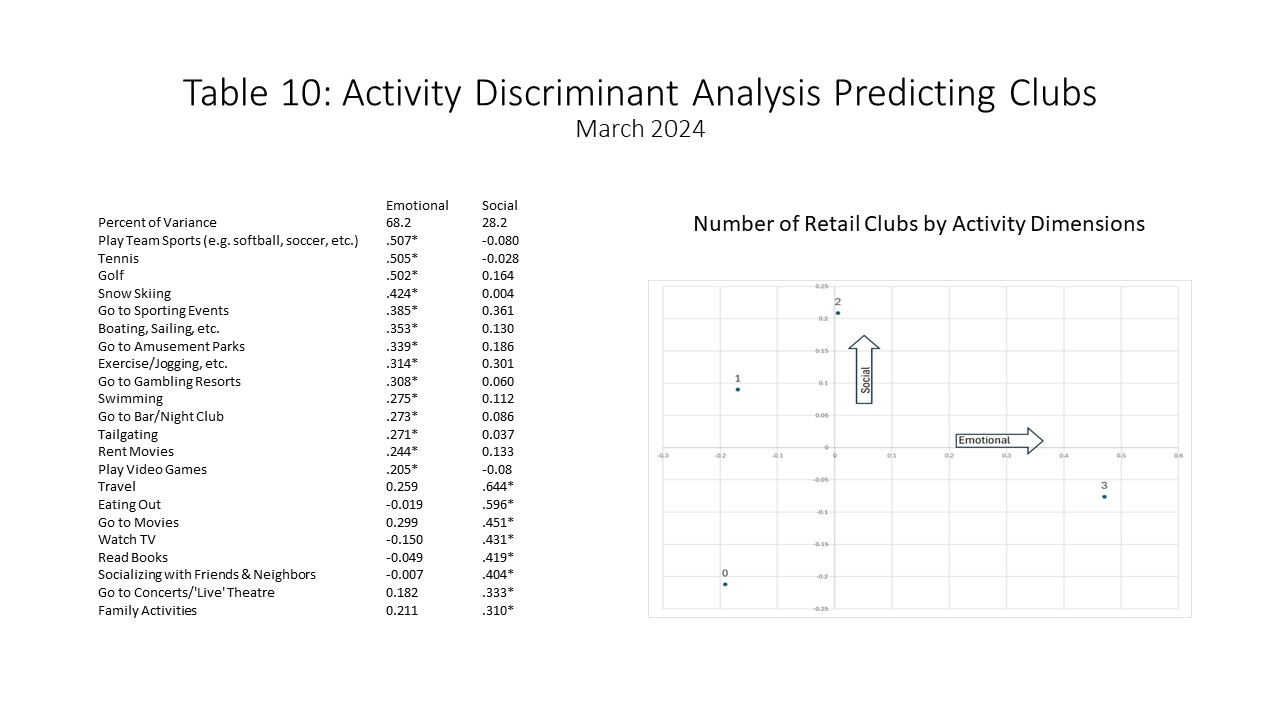
Respondents are asked to indicate what activities are their favorite ways of spending their free or leisure time—a discriminant analysis predicting retail club membership from the various activities. Table 10 shows the result with the structure matrix on the left. Activities such as playing team sports can be interpreted as making one feel better. Hence, the first function is labeled as “emotional.” Activities such as travel and eating can be interpreted as promoting social behavior, leading to the second function being labeled “social.” The plot on the right shows the four club membership categories plotted against the two functions. The biggest difference (the horizontal axis) is that those belonging to three or more clubs indicate higher emotional or feeling activities. Those with no membership show the least in this dimension. The difference between those holding one or two memberships and three or more memberships is the social activity dimensions. This might suggest that social activity draws in the beginning, but this diminishes as the membership increases perhaps related to experience.
Streaming Services
Streaming services seem to be related to retail club memberships. The media usage environment is changing, as shown in Table 11. To avoid COVID-19 distortions, a comparison is made between March 2023 and March 2024. The average minutes per day calculated from dayparts are shown on weekdays and weekends. Simultaneous consumption is ignored.
The largest changes, expressed as a percentage, are in social media, streaming TV, surfing the internet, and email. Social media and streaming TV both show a 16% increase over the last year. Surfing the internet and email show a 10% increase. This no doubt represents good news for retail media networks. Traditional TV shows a 7% increase. Newspapers and magazines both show a decrease.
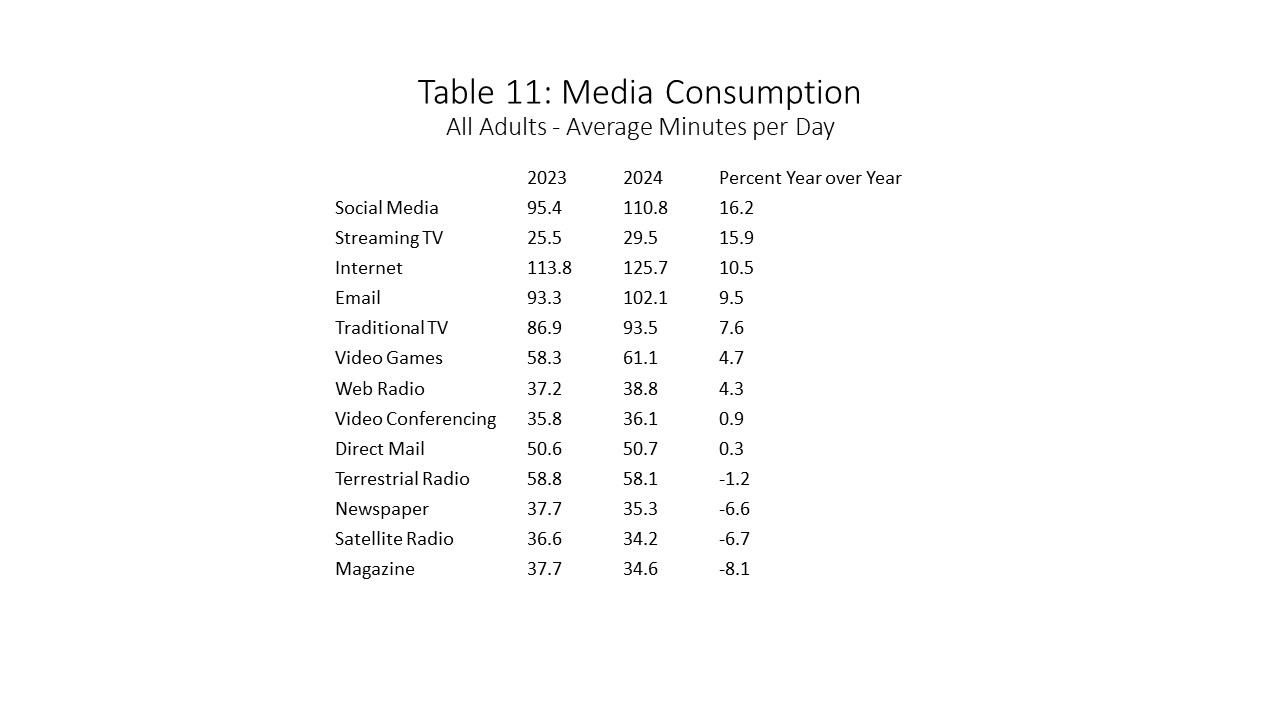
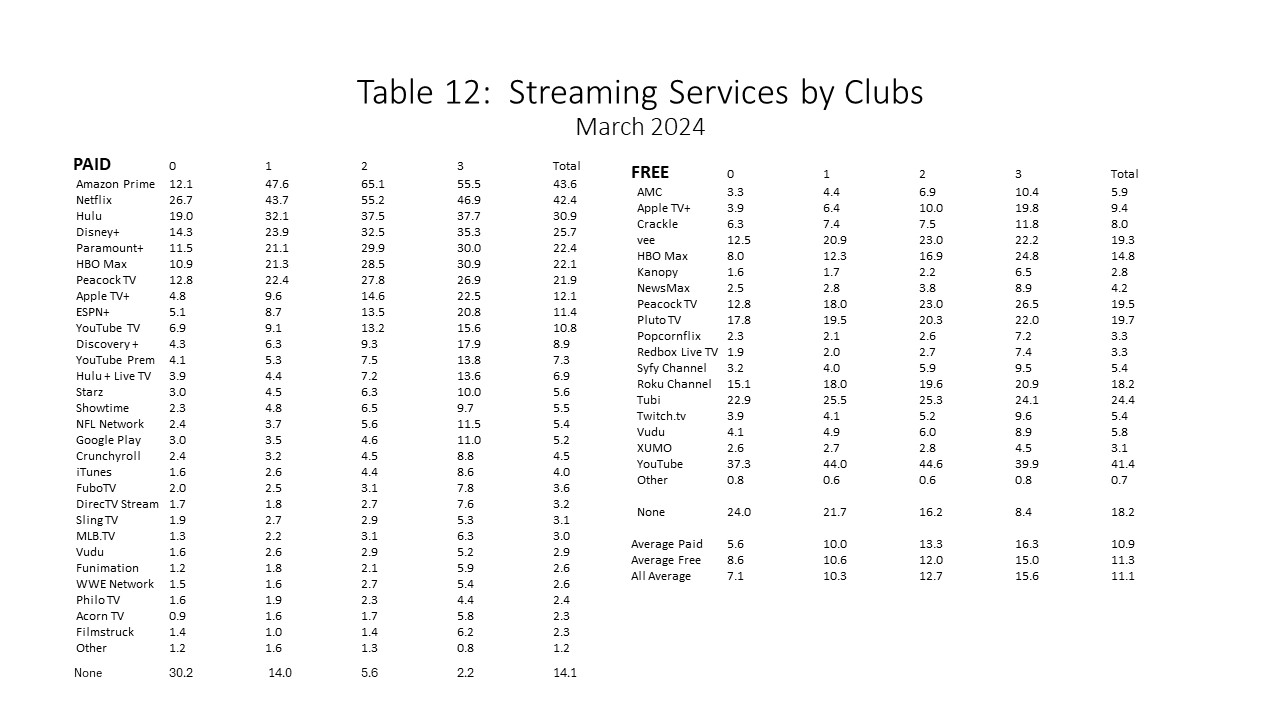
Table 12 shows the relationship between both paid and free streaming services. The leading paid streaming service is Amazon Prime Video, closely followed by Netflix. Those not using paid streaming services are considerably more likely to have no retail club membership. The leading free streaming service is, by far, YouTube. The average usage of paid services among those with no club memberships is approximately half the overall. Paid usage goes up with the number of clubs. The same relationship can be seen among free services as well as all streaming services. The free service average is higher than the paid service average, but this reverses as the club membership increases.
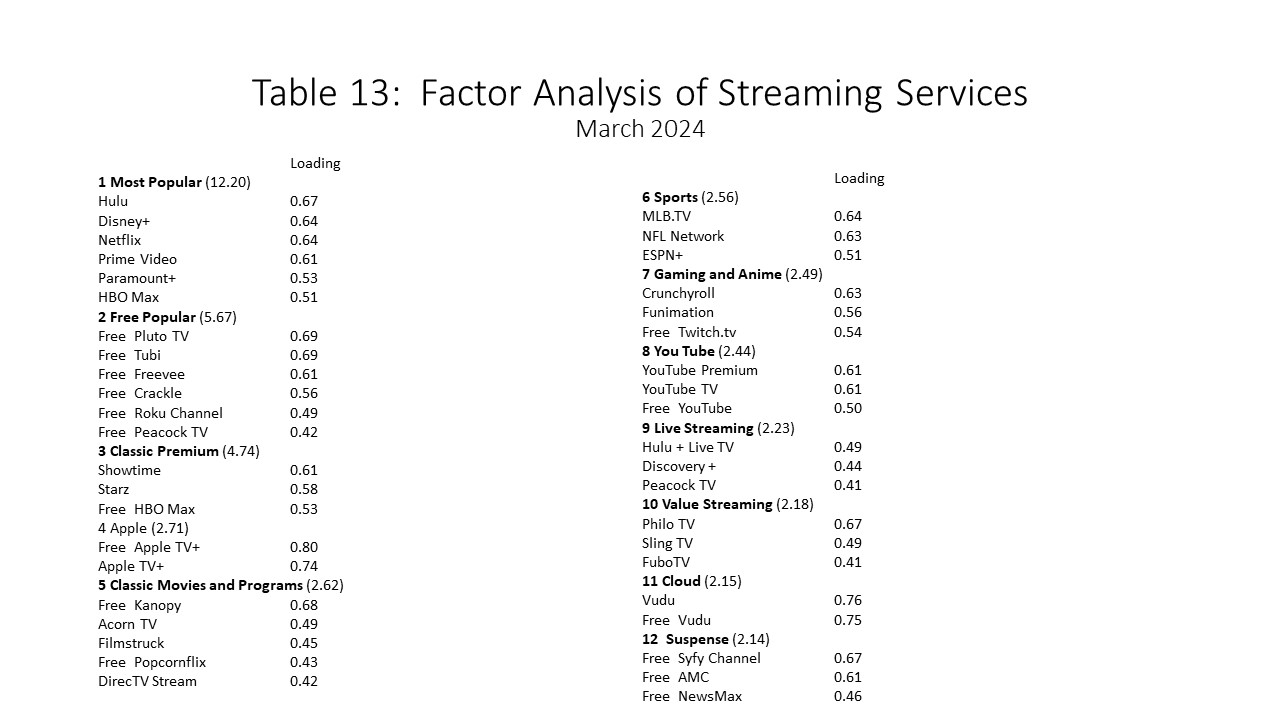
A factor analysis was performed to better understand how streaming services might relate to each other. Twelve usage factors were derived to explain a total of 44.1% of the variance. Table 13 shows the results with each factor in bold, with the variance shown in parentheses. The implication for the most popular factor is that subscribing to any of the six listed makes the consumer more likely to subscribe to the other five. In other words, Amazon Prime Users are also more likely to be Paramount+ users. Factors like sports and suppliers such as Apple and YouTube seem to be organized by focus. It is interesting that the Syfy channel and NewsMax users group together.
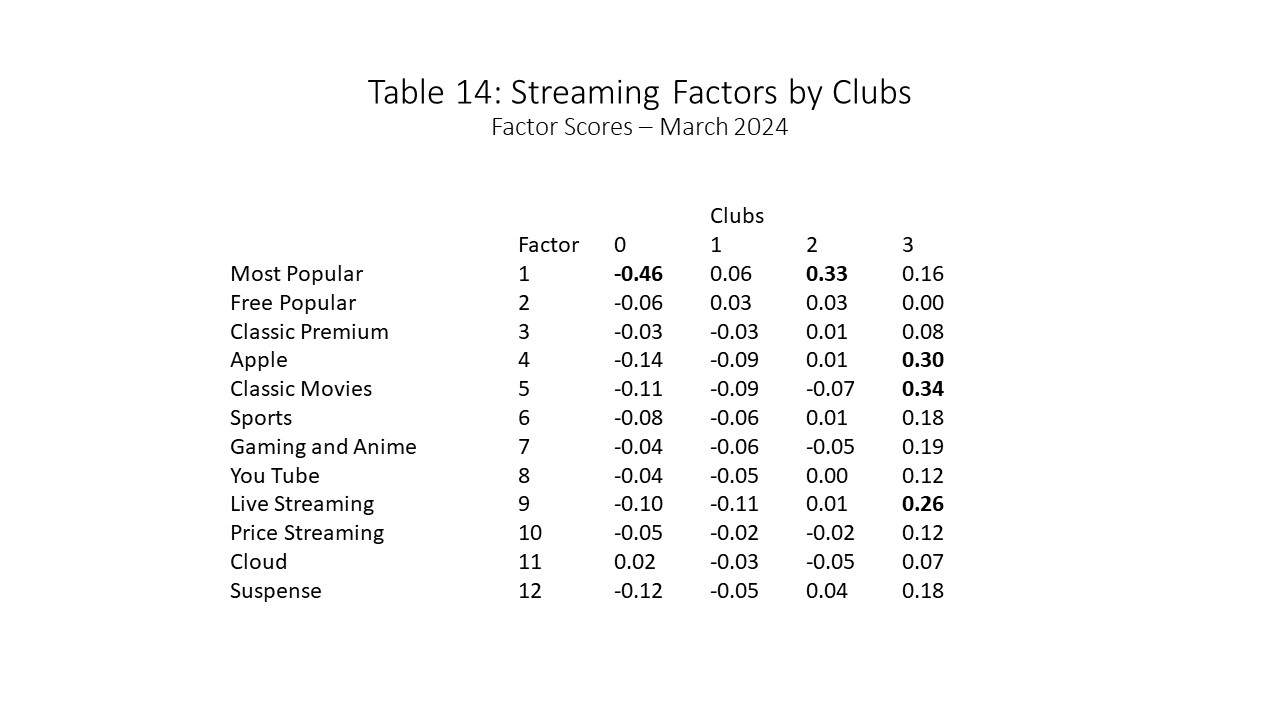
Comparing the streaming factors to retail club memberships can be done by comparing factor scores. As shown in Table 14, those with no retail club membership are by far the lowest in using popular services such as Netflix. The most popular usage is highest among those with two memberships. Those with three or more memberships are Apple classic movies and live streaming services. Overall, it appears that no factor group dominates retail club membership.
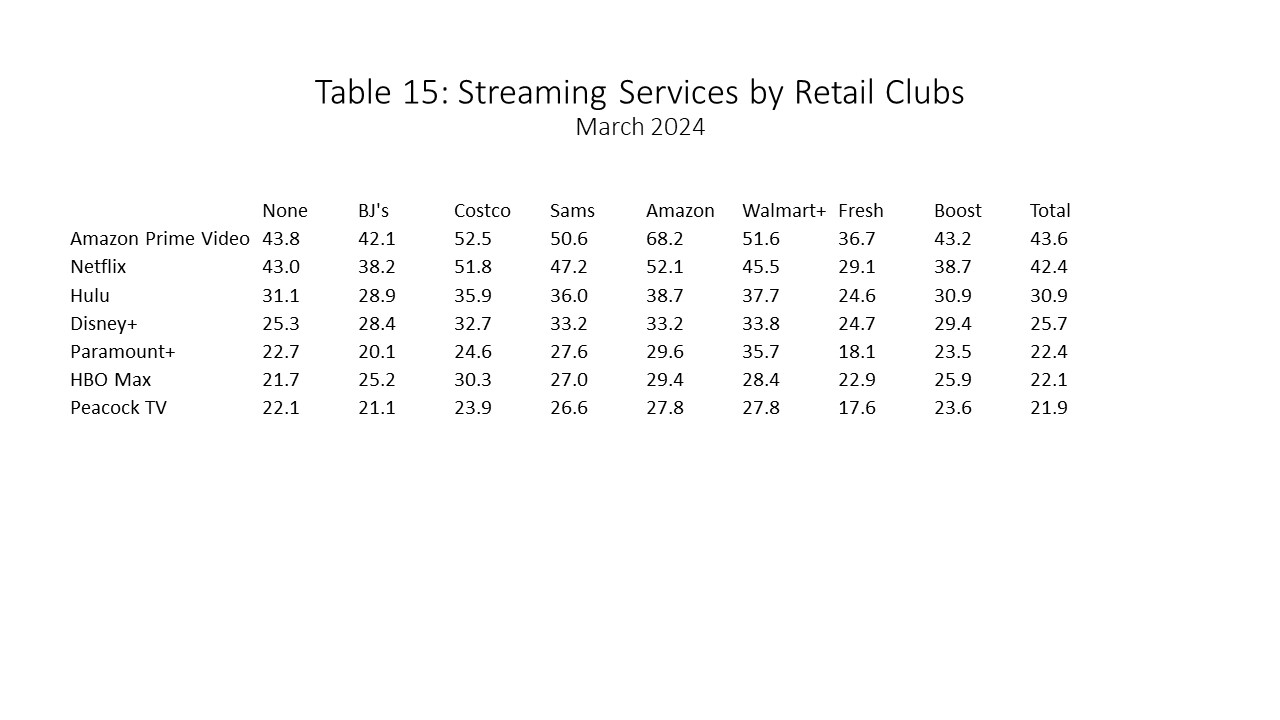
As shown in Table 15, there is a strong relationship between Amazon Prime Video and having an Amazon Prime membership. Amazon Prime Video leads among every other club membership, with Netflix being second. It is interesting that Amazon Prime Video is higher among Walmart+ members. Among Walmart+ members, Paramount+ is behind Amazon Prime Video, Netflix, and Hulu.
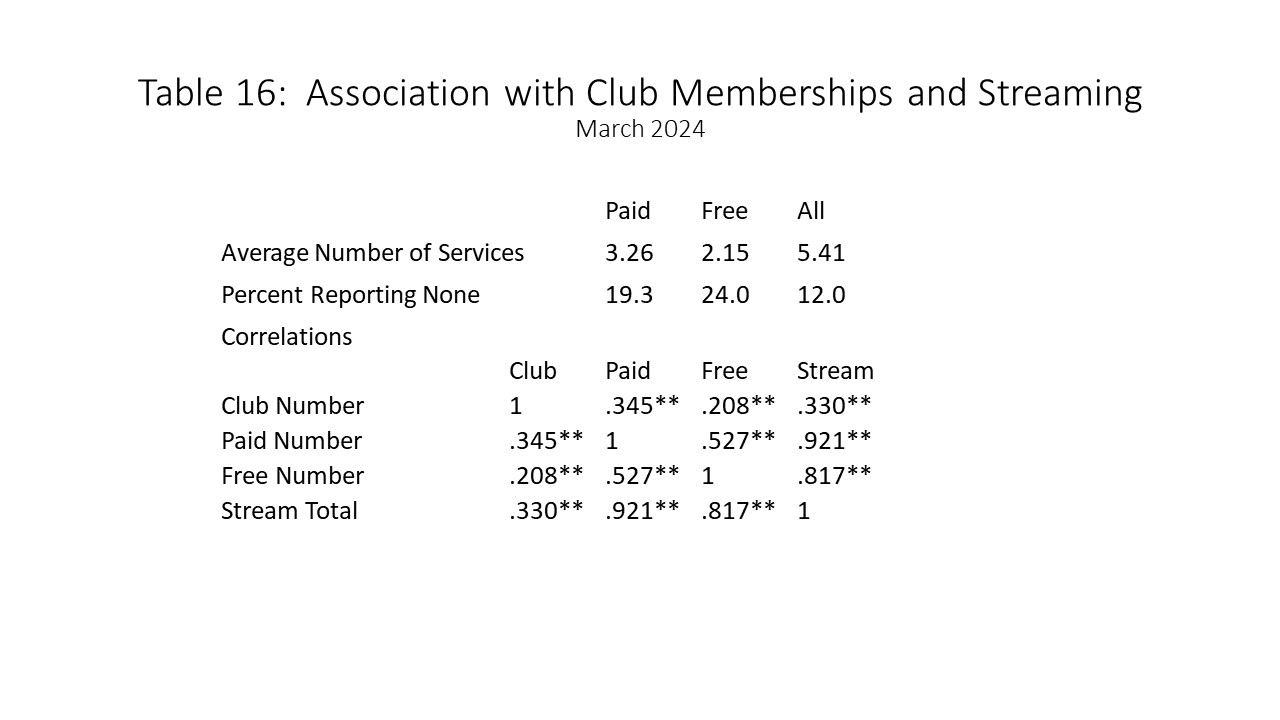
The average number of streaming services used overall is 5.4, as shown in Table 16. Of these, 3.3 are paid, and 2.1 are free. The correlation between club membership and streaming usage is .33. The correlation between paid streaming and club membership is slightly higher, at .35. There is also a correlation between paid and free streaming, at .53.
Summary
Retail club memberships are divided into four groups: those with none, those with one, those with two, and those with three or more. Retail club members are more likely to be married, have larger households and children, and are slightly concentrated among millennials. They also have higher incomes. They are also more likely to be members of other organizations, perhaps indicating a need to belong. Also, club membership appears to benefit not only the specific retailer but others as well.
Retail club members tend to be happier and are motivated by emotions or feelings as well as social needs. There is a clear association between retail club membership and streaming service usage.