Executive Summary:
Father’s Day, observed on Sunday, June 16, 2024, is the sixth most popular American holiday, surpassing Halloween but trailing behind the Super Bowl. While participation in Father’s Day celebrations has remained steady, spending is down, particularly on physical gifts. Demographic factors such as marital status, presence of children, and income strongly influence celebration plans.
Key highlights include:
- 4% of respondents celebrate Father’s Day, a slight decrease compared to previous years.
- The average planned spending for Father’s Day is $184.81, significantly lower than the $254.04 for Mother’s Day.
- Despite overall declines, online shopping remains the leading retail outlet for Father’s Day gifts, accounting for 42.3% of purchases.
- Unique or different gifts are prioritized (46.7%), followed by those creating special memories (39.2%).
- Over 60% of respondents have noticed higher prices, particularly in clothing and dining out.
- Celebrators are more likely to be male, married, have children, and belong to younger generations (Gen-Z and Millennials).
Father’s Day celebrators report higher overall happiness, particularly in their love life, work life, and government satisfaction.
Retail Trends, Spending, and Father’s Day Celebratory Patterns
By Dr. Martin Block, Professor Emeritus, Northwestern University, Retail Analytics Council
Father’s Day (Sunday, June 16, 2024) is the sixth most popular American holiday, ranking between the Super Bowl and Halloween. Celebrating Father’s Day is among the topics covered by Prosper Insights & Analytics (www.ProsperInsights.com) in the monthly online surveys that collect data about annual events and related market behavior. Celebrating Father’s Day was asked in the May 2024 survey (n=8,580). In response to the question, “Do you expect to spend more, the same or less for Father’s Day than you spent last year?” Of the total, 24.6% said they don’t celebrate Father’s Day, leaving 75.4% who do. As shown in Table 1.
Table 1. Seasonal Holiday Participation.
| Percent | |
| Christmas | 93.4 |
| 4th of July | 87.2 |
| Mother’s Day | 84.2 |
| Celebrate Easter | 80.7 |
| Super Bowl | 76.9 |
| Father’s Day | 75.4 |
| Halloween | 73.1 |
| St. Patrick’s Day | 61.9 |
| Valentines Day | 52.0 |
| Graduation | 33.6 |
Recent Father’s Day Celebration History
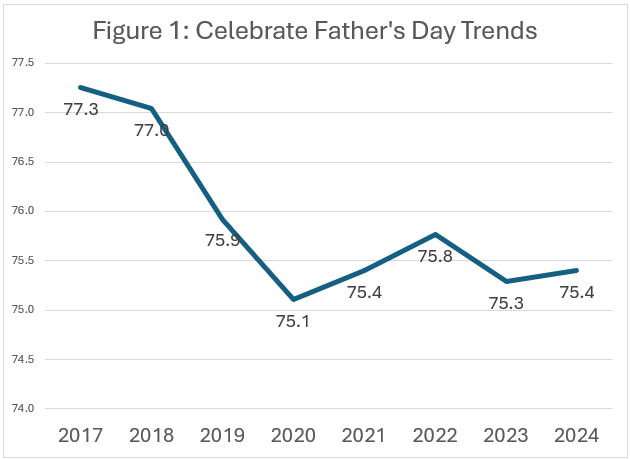
The Father’s Day celebration rate has remained relatively flat, especially for the last five years, as shown in Figure 1. The rate dropped slightly in 2021, no doubt related to COVID-19.
Celebrating Father’s Day is more complicated because it can involve different people. Table 2 shows that the most common recipient is a father or stepfather, at 41.0%. This is followed by a husband, at 21.8%. The base is the total sample.
Table 2. Father’s Day Recipients.
| Percent | |
| Father or Stepfather | 41.0 |
| Husband | 19.5 |
| Son | 6.5 |
| Brother | 6.4 |
| Friend | 6.0 |
| Other relative | 5.6 |
| Grandfather | 5.0 |
| Godfather | 1.5 |
The overall average planned spend of $184.81 was reported for Father’s Day, as shown in Table 3. This compares to the $254.04 reported for Mother’s Day last month.
The leading categories purchased are greeting cards, clothing, and a special outing. The categories in Table 3 are ranked by how often they are purchased. All categories, except greeting cards, have increased over the last eight years but have all declined year over year compared to 2023. The sharpest year-over-year percentage decreases are in more expensive physical items such as consumer electronics, automotive accessories, home improvement, gardening tools and sporting goods.
Table 3. Planned Father’s Day Buying.
| Percent | Spend Amount | Year over Year | AGR | |
| Greeting Cards | 58.4 | 12.74 | -3.89 | -0.70 |
| Clothing | 54.2 | 53.65 | -1.11 | 1.58 |
| Special Outing | 51.6 | 74.28 | -0.56 | 0.71 |
| Gift Certificates | 48.1 | 48.10 | -0.20 | 0.99 |
| Personal Care | 31.5 | 28.40 | -0.20 | 1.96 |
| Tools or Automotive | 24.6 | 66.18 | -5.53 | 1.52 |
| Consumer Electronics | 24.2 | 60.74 | -9.88 | 0.83 |
| Books or CDs | 23.0 | 27.52 | -5.33 | 0.15 |
| Automotive Accessories | 22.0 | 46.25 | -8.26 | 1.25 |
| Home Improvement | 21.9 | 46.87 | -9.90 | 1.21 |
| Sporting Goods | 21.8 | 57.74 | -8.58 | 1.11 |
| Other | 36.4 | 56.22 | -9.62 | 0.69 |
| Total Average Spend | 75.6 | 184.81 |
Where celebrators are spending their money is also changing. Table 4 shows that online is the leading source for gift purchases, with just over 35%. Online and specialty clothing stores have both increased over the last eight years. However, even online, there has been a year-over-year decrease since 2023.
Table 4. Retail Outlets.
| Percent | AGR | Year over Year | |
| Online | 42.3 | 1.44 | -1.94 |
| Department Store | 38.3 | -0.37 | 0.87 |
| Discount Store | 23.6 | -0.33 | -1.40 |
| Specialty Store (Greeting Card/Gift Store, Electronics Store) | 22.1 | -0.21 | -0.76 |
| Local/Small Business | 18.9 | 0.19 | -4.82 |
| Specialty Clothing Store | 14.5 | 0.63 | -4.75 |
| Catalog | 2.0 | 0.0 | -11.6 |
About one-third say they look to the retailer for gift inspiration, as shown in Table 5. Another third say they look sometimes. This represents a substantial opportunity for the retailer.
Table 5. Look to Retailers for Gift Inspiration.
| Percent | |
| Always | 12.3 |
| Very often | 20.2 |
| Sometimes | 34.3 |
| Not very often | 15.6 |
| Never | 17.6 |
Table 6 shows what is important to celebrators when purchasing Father’s Day gifts. At 47%, the leading reason is finding a unique or different gift. This is followed by finding a gift that creates a special member at 39%. Convenience and cost-effectiveness are much lower on the list.
Table 6. Importance in Gift Purchasing.
| Percent | |
| Finding a gift that’s convenient for me | 24.0 |
| Finding a gift that’s unique or different | 46.7 |
| Finding a gift that’s cheaper or most cost-effective | 20.1 |
| Finding a gift that creates a special memory | 39.2 |
| Other | 8.6 |
Higher prices seem to be an important factor. Over three out of five say they have noticed higher prices, as shown in Table 7. The top reported categories with higher prices are clothing and dining out. Nearly one-fifth say they are celebrating more people.
Table 7. Noticed Higher Prices.
| Percent | |
| Yes, much higher | 24.9 |
| Yes, somewhat higher | 37.5 |
| The same | 32.9 |
| No, somewhat lower | 2.5 |
| No, much lower | 2.2 |
| Clothing | 61.5 |
| Dining out | 60.8 |
| Electronics | 54.7 |
| Tools or appliances | 43.7 |
| Home improvement or gardening supplies | 41.6 |
| Sporting goods or leisure items | 38.4 |
| Greeting cards | 37.5 |
| Automotive accessories | 34.5 |
| Personal care | 33.8 |
| Books or CDs | 27.0 |
| Other | 3.5 |
As a result of noticing higher prices, the leading response is to take advantage of sales and promotions, as shown in Table 8. Cutting back, preparing a meal at home, and buying fewer gifts are also mentioned; about one-third say they are buying fewer or no gifts.
Table 8. Result of Higher Prices Plans.
| Percent | |
| Take advantage of sales and promotions | 63.3 |
| Cutting back in other areas | 32.2 |
| Prepare a meal at home instead of going out to eat | 25.6 |
| Buying gifts for fewer people | 23.2 |
| Not buying gifts | 10.1 |
| Using Buy Now, Pay Later | 6.7 |
Another possible gift is a subscription box service. Celebrators were asked how interested they would be in giving a product subscription box service this Father’s Day. Table 9 shows that 41% are interested, and 39% are not. These responses almost exactly mirror the Mother’s Day responses.
Table 9. Interest in a Product Subscription Box Service.
| Percent | |
| Very interested | 14.4 |
| Somewhat interested | 27.1 |
| Not very interested | 19.2 |
| Not interested at all | 39.3 |
Father’s Day Celebrators
Describing who the Father’s Day celebrators are is shown in Table 10. The comparison is made according to their planned spend in 2024. About 16.6% report planning to spend more. 47.4% plan to spend the same, while only 11.55% plan to spend less compared to 2023. The 24.6% that don’t celebrate was reported earlier. To facilitate comparison, an index is computed comparing the percentage of those who don’t celebrate to the total. As shown in Table 10, celebrators are more likely to be male, noting that those who are not celebrating are ranked lower. Those who are married, have children and are either Gen-Z or Millennial are more likely to celebrate Father’s Day. Those divorced or widowed and a Boomer or Senior are less likely to celebrate. Celebrators also have higher incomes.
Table 10. Celebrator Demographics.
| Don’t | Celebrate | Total | Don’t Index | ||
| Male | 43.7 | 47.6 | 46.7 | 93.6 | |
| Female | 56.3 | 52.4 | 53.3 | 105.6 | |
| Married | 27.2 | 43.5 | 39.5 | 68.9 | |
| Living with Unmarried Partner | 7.4 | 10.5 | 9.8 | 75.5 | |
| Divorced or separated | 20.0 | 10.5 | 12.9 | 155.0 | |
| Widowed | 10.0 | 3.7 | 5.3 | 188.7 | |
| Single, never married | 35.2 | 31.8 | 32.6 | 108.0 | |
| Have Children | 14.6 | 38.8 | 32.9 | 44.3 | |
| Income ($000) | 52.2 | 62.1 | 59.7 | 87.4 | |
| Gen-Z | 10.5 | 19.6 | 17.4 | 60.3 | |
| Millennials | 13.7 | 28.0 | 24.5 | 55.9 | |
| Gen-X | 25.2 | 28.8 | 27.9 | 90.3 | |
| Boomers | 45.0 | 21.8 | 27.4 | 164.2 | |
| Seniors | 5.6 | 1.8 | 2.7 | 207.4 | |
| Average Age | 56.4 | 46.1 | 48.6 | 116.2 | |
| African American | 8.3 | 9.5 | 9.2 | 90.2 | |
| Asian | 2.0 | 2.6 | 2.5 | 80.0 | |
| Multi-Racial | 1.9 | 2.2 | 2.1 | 90.5 | |
| Native American | 1.4 | 1.6 | 1.5 | 93.3 | |
| White | 29.4 | 25.8 | 26.7 | 110.1 | |
| Hispanic | 52.1 | 51.8 | 51.9 | 100.4 | |
| Rural | 26.9 | 25.2 | 25.6 | 105.1 | |
| Urban | 38.2 | 38.4 | 38.4 | 99.5 | |
| Suburban | 33.9 | 35.6 | 35.2 | 96.3 | |
Happiness
Respondents are asked to rate their overall happiness across ten categories on a five-point scale. Table 11 shows the proportion of the combination of happy and totally happy. The unmistakable conclusion is that those who plan to celebrate Mother’s Day are happier than those who do not, as shown in the composite average. The biggest differences are in love life, work life, and government, as seen among previous Easter and Mother’s Day celebrators in the last two months.
Table 11. Happiness by Father’s Day Celebration.
| Don’t | Celebrate | Total | Don’t Index | |
| Health | 47.4 | 53.0 | 51.6 | 91.8 |
| Family | 57.4 | 63.9 | 62.3 | 92.1 |
| Friends | 58.2 | 60.5 | 59.9 | 97.0 |
| Love Life | 37.6 | 53.3 | 49.5 | 76.1 |
| Home | 59.5 | 62.4 | 61.7 | 96.3 |
| Religion | 52.4 | 56.4 | 55.4 | 94.6 |
| Work Life | 33.2 | 43.3 | 40.9 | 81.2 |
| House | 56.1 | 59.3 | 58.5 | 95.8 |
| Neighborhood | 57.3 | 57.8 | 57.7 | 99.3 |
| Government | 16.8 | 22.6 | 21.2 | 79.3 |
| Composite | 47.6 | 53.3 | 51.9 | 91.7 |
Summary
Father’s Day ranks between the Super Bowl and Halloween. Celebrating the day has remained almost flat in the last eight years. Spending, however, is also down, especially on physical gifts. The presence of children, age, marital status, and income are the strongest predictors of planning to celebrate. Celebrators are shopping more online, even though shopping is slightly down in 2024. Father’s Day celebrators are also happier than those who don’t plan to celebrate.