Executive Summary:
Halloween remains a key retail event in the United States, attracting millions of consumers and generating significant economic activity through costume purchases, decorations, and seasonal festivities, even amidst varying participation rates and broader economic fluctuations.
- In 2024, 72.4% of adults plan to celebrate Halloween.
- The most common Halloween activities include handing out candy, decorating, and dressing in costumes, with nearly 20% of participants planning to dress their pets.
- Households expect to spend an average of $150, primarily on costumes and decorations, with a consistent annual increase of $5.16 despite inflation.
- Discount stores are the leading shopping outlet at 37.1%, while online shopping is on the rise at 32.6%, with consumers increasingly using various outlets.
- Although 81.5% of respondents were undecided in September, popular children’s costumes include Spiderman, Ghost, and Batman, with 59.6% of adults planning to buy costumes and 35.7% purchasing costumes for pets.
- Economic factors influence Halloween spending for over a third of respondents, many plan to spend less or reuse items from previous years.
- Seventy-five percent of respondents expect higher prices for Halloween items, particularly candy and costumes, with 37% intending to reuse decorations to manage these costs.
- Key predictors of Halloween participation include age, income, marital status, and household composition, with younger, higher-income households with children showing the highest celebration rates at 93.6%.
When It Comes to Halloween, Consumers Aren’t Scared of Inflation:
New Medill Analysis Shows Steady Increases in Halloween Spending
By Dr. Martin Block, Professor Emeritus, Northwestern University, Retail Analytics Council
Halloween is a major retail event that rivals the popularity of the Superbowl and Father’s Day. Adults were asked about Halloween in the September 2024 Prosper survey (n=7,945). In response to the question, “Do you plan to celebrate Halloween or participate in Halloween activities this year? The percentages shown are in Table 1 for 2024, except for the November and December items, which are for 2023.
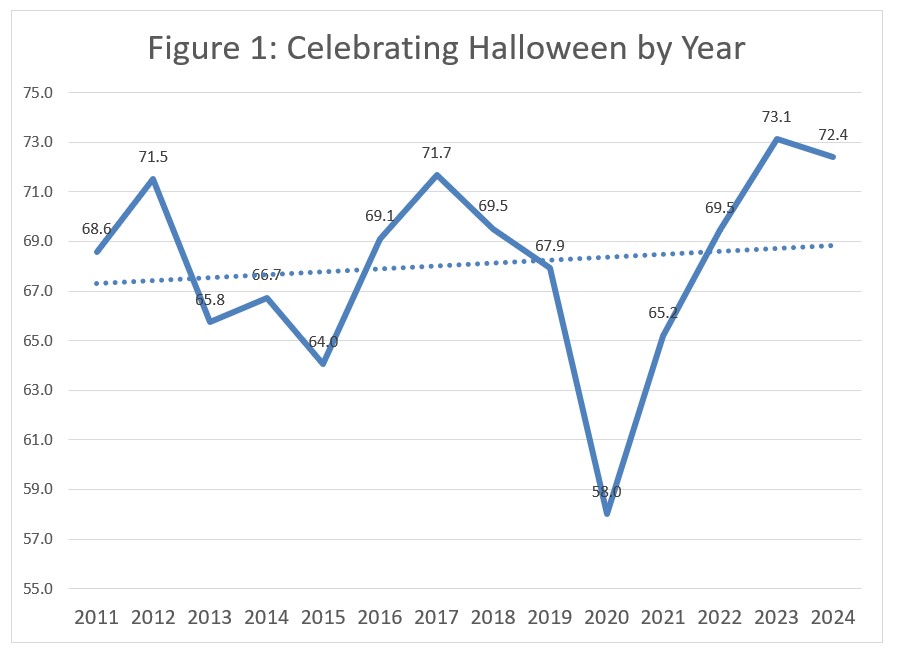
Overall, 72.4% of respondents reported planning to celebrate. Figure 1 shows the trend for responses to this question since 2011. The 2024 results represent a very small decrease from 2023 of 73.3%. It is noteworthy that Halloween celebrations dropped sharply during the pandemic, reaching a low of 58.0%. Even with the pandemic, the proportion of people celebrating Halloween has increased.
Table 1: Holidays by Month
| Month | Holiday | Percent |
| January | Super Bowl | 76.9 |
| February | St. Patrick’s Day | 61.9 |
| Valentines Day | 52.0 | |
| Easter | Celebrate Easter | 80.7 |
| May | Mother’s Day | 84.2 |
| June | Father’s Day | 75.4 |
| Graduation | 33.6 | |
| July | 4th of July | 87.2 |
| Back to School | 40.1 | |
| August September | ||
| October | Halloween | 72.4 |
| November | Thanksgiving* | 73.9 |
| December | Christmas* | 93.4 |

Among those planning to celebrate, the most popular activity is handing out candy, as shown in Table 2. Note that these activities are not mutually exclusive. Decorating for the holiday is reported by 52% and nearly the same percentage, 48.6%, say dressing in a costume. Nearly one in five (19.9%) say they plan to dress their pets.
Table 2: Halloween Celebration Plans
| Percent | |
| Hand out candy | 67.0 |
| Decorate your home/yard | 52.3 |
| Dress in costume | 48.6 |
| Carve a pumpkin | 43.1 |
| Throw/attend a party | 29.1 |
| Take children trick-or-treating | 26.4 |
| Visit a haunted house | 21.3 |
| Dress your pet(s) in costume | 19.9 |
| Other | 3.5 |
Halloween Spending
The average Halloween expected spending is $150 per household. The largest categories are costumes at $51 and decorations at $45, as shown in Table 3. Halloween compares to the Fourth of July spending of $87, Father’s Day spending of $185, and Mother’s Day spending of $254.
Table 3: Halloween Spending by Category
| 2024 | AGR | |
| Costumes | 50.75 | 1.17 |
| Candy | 33.36 | 1.24 |
| Decorations | 44.84 | 1.77 |
| Cards | 21.24 | 0.98 |
| Total | 150.18 | 5.16 |
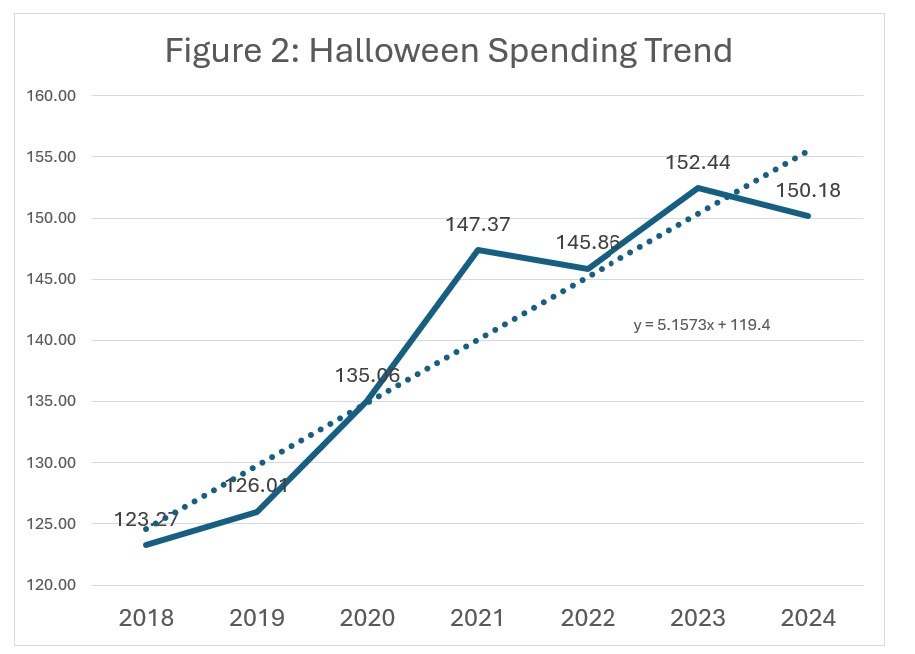
The average spending steadily increases, as shown in Figure 2. On average, the annual increase has been $5.16 despite a small decrease in 2024 compared to 2023. Part of the increase in spending can be attributed to inflation.

The pattern of planned spending also changes, as shown in Table 4. Discount stores are the largest category in 2024 at 37.1% but decreasing at a rate of 1.25% annually. Online Halloween shopping stands at 32.6% and is growing at an annual rate of 1.62%. Note that the percentages reflect multiple categories. Halloween shopping is done through a variety of outlets and retail categories.
Table 4: Where Will You Purchase (Percent)
| 2024 | AGR | |
| Discount store | 37.1 | -1.25 |
| Specialty Halloween/costume store | 33.0 | -0.03 |
| Online | 32.6 | 1.62 |
| Grocery store/supermarket | 27.9 | 0.34 |
| Department store | 21.8 | 0.23 |
| Home décor store | 13.2 | 0.54 |
| Thrift stores/resale shops | 11.7 | 0.10 |
| Crafts or fabrics store | 11.6 | -0.06 |
| Clothing store | 11.3 | 0.36 |
| Local/small business | 8.9 | 0.33 |
| Home improvement store | 8.5 | 0.48 |
| Greeting card/gift store | 6.9 | -0.01 |
| Drug store | 6.8 | -0.34 |
| Catalog | 2.9 | -0.07 |
Where Halloween celebrators say they look for inspiration for costumes, as shown in Table 5. The leading categories include online search at 37.7% and a variety of social networks. TikTok is by far the fastest growing. It is interesting that “friends and family” stands at 20.2% with no growth. Retail stores are second at 27.6% but are decreasing. Again, the categories are not mutually exclusive. Only about one in four (24.0%) say they will not wear a costume.
Table 5: Where to Look for Inspiration (Percent)
| 2024 | AGR | |
| Online Search | 37.7 | 0.36 |
| Within a retail store or costume shop | 27.6 | -0.38 |
| Does not apply/Will not wear a costume | 24.0 | -0.36 |
| Friends/Family | 20.2 | 0.00 |
| 18.4 | 1.26 | |
| YouTube | 18.1 | 0.79 |
| 17.3 | 0.14 | |
| Pop Culture (celebrities, TV shows, movies, etc.) | 16.4 | 0.06 |
| 15.9 | -0.34 | |
| Tik Tok | 15.0 | 2.61 |
| Print Media (magazines, catalogs, etc.) | 9.4 | -0.55 |
| X (Formerly Twitter) | 7.7 | 0.30 |
| Current Events | 7.4 | 0.04 |
| Habit/Wear the same costume each year | 7.1 | 0.14 |
| Other | 3.4 | 0.00 |
| Blogs | 2.5 | -0.08 |
Costumes
Respondents were asked about their plans for Halloween costumes. Since the survey was administered during the first week of September, the most frequent response was “don’t know” at 81.5%, as shown in Table 6. Of the total sample, 32.9% said they have children, which is the base for Table 6. The leading costume for children is Spiderman. The question was only asked to respondents with children at home.
Table 6: Costume Plans for Children
| Children Percent | |
| Spiderman | 2.7 |
| Ghost | 1.9 |
| Batman | 1.6 |
| Princess | 1.6 |
| Witch | 1.5 |
| Pumpkin | 0.8 |
| Mario | 0.7 |
| Vampire | 0.7 |
| Wednesday Adams | 0.7 |
| Deadpool | 0.6 |
| Superman | 0.6 |
| Zombie | 0.6 |
| Beetle juice | 0.5 |
| Paw Patrol | 0.5 |
| Dinosaur | 0.4 |
| Ironman | 0.4 |
| Minecraft | 0.4 |
| Mickey Mouse | 0.3 |
| Monster | 0.3 |
| Ninja Turtle | 0.3 |
| Pokémon | 0.3 |
| Dracula | 0.2 |
| Elsa | 0.2 |
| Hulk | 0.2 |
| Jason | 0.2 |
| Lady Bug | 0.2 |
| Skeleton | 0.2 |
| Taylor Swift | 0.2 |
| Others and Don’t Know | 81.5 |
| Total | 100 |
Of those planning to spend money on costumes, it is interesting that adults are the leading category at 59.6%, with an average spend of $41, as shown in Table 7. The average spend is about the same for children. Interestingly, 35.7% say they plan on purchasing a costume for a pet, although at a lower amount of $26.
Table 7: Planned Spend on Costumes
| Percent | Spend | |
| Child/Children | 42.5 | 42.20 |
| Adults | 59.6 | 41.02 |
| Pets | 35.7 | 25.92 |
| All 3 | 20.6 |
Shopping Experience
Table 8 shows again that the majority, 52.7%, of Halloween shopping planning is in October. Although a large portion, 39.1%, planned on shopping in September.
Table 8: When are you Planning to Shop
| Percent | |
| Before September | 8.2 |
| September | 39.1 |
| First 2 weeks of October | 39.3 |
| Last 2 weeks of October | 13.4 |
A significant proportion of the sample, 36%, say the economy will impact their Halloween spending. Table 9 shows the reported impacts, which are led by spending less overall at 73.7%. The categories are not mutually exclusive. More than a third, 36.9%, say they are buying less candy and 9.0% say they are not handing out candy this year.
Table 9: Impact on Halloween Spending
| Percent | |
| Spending less overall | 73.7 |
| Buying less candy this year | 36.9 |
| Putting up last year’s decorations with no plans to buy more | 23.1 |
| Not participating in as many Halloween activities (i.e. haunted house, spooky amusement parks, fall festivals, etc.) | 19.9 |
| Making a costume(s) instead of purchasing | 18.3 |
| Using last year’s costume(s) | 18.2 |
| Buying Halloween-related items secondhand | 12.1 |
| Not handing out candy this year | 9.0 |
| Other | 1.3 |
Many celebrators, 69.1%, say they don’t anticipate any difficulty in finding Halloween items, as shown in Table 10. Slightly more anticipate less difficulty shopping online than in a store.
Table 10: Anticipate Difficulty Finding Halloween Items
| Percent | |
| Yes, in-store | 14.2 |
| Yes, online | 6.6 |
| Yes, in-store and online | 10.1 |
| No, I don’t anticipate any difficulty finding Halloween items | 69.1 |
Of those expecting some difficulty, the leading category is costumes, as shown in Table 11. Decorations and candy are significantly less, and greeting cards are by far the least.
Table 11: Which Items Difficult
| Percent | |
| Costumes | 61.4 |
| Decorations | 41.3 |
| Candy | 38.1 |
| Greeting cards | 11.9 |
About three in four, 75.2%, expect higher prices, as shown in Table 12. Table 13 shows that higher prices are expected across all the Halloween categories with candy leading the list. Greeting cards are expected to be higher in price by just over one-fourth, 26.8%.
Table 12: Expect to See Higher Prices
| Percent | |
| Yes, much higher | 24.2 |
| Yes, somewhat higher | 51.0 |
| The same | 21.8 |
| No, somewhat less | 2.0 |
| No, much less | 1.0 |
Table 13: Which Items Expect to See Higher Prices
| Percent | |
| Candy | 79.5 |
| Costumes | 72.9 |
| Decorations | 69.4 |
| Greeting cards | 26.8 |
Actions identified to accommodate higher prices for Halloween items are shown in Table 14. At the top of the list is reusing items from previous years, at 37.0%. Cutting back in other areas at 24.1% indicates some people are concerned about higher prices for Halloween.
Table 14: Actions to Accommodate Higher Prices
| Percent | |
| Reusing Halloween items from previous years | 37.0 |
| Cutting back in other areas | 24.1 |
| Working overtime or taking on additional hours | 12.0 |
| Using Buy Now, Pay Later | 7.8 |
| Taking out additional credit cards | 6.0 |
| Borrowing money or going into debt | 5.0 |
| None of the above | 36.1 |
Halloween Celebrators
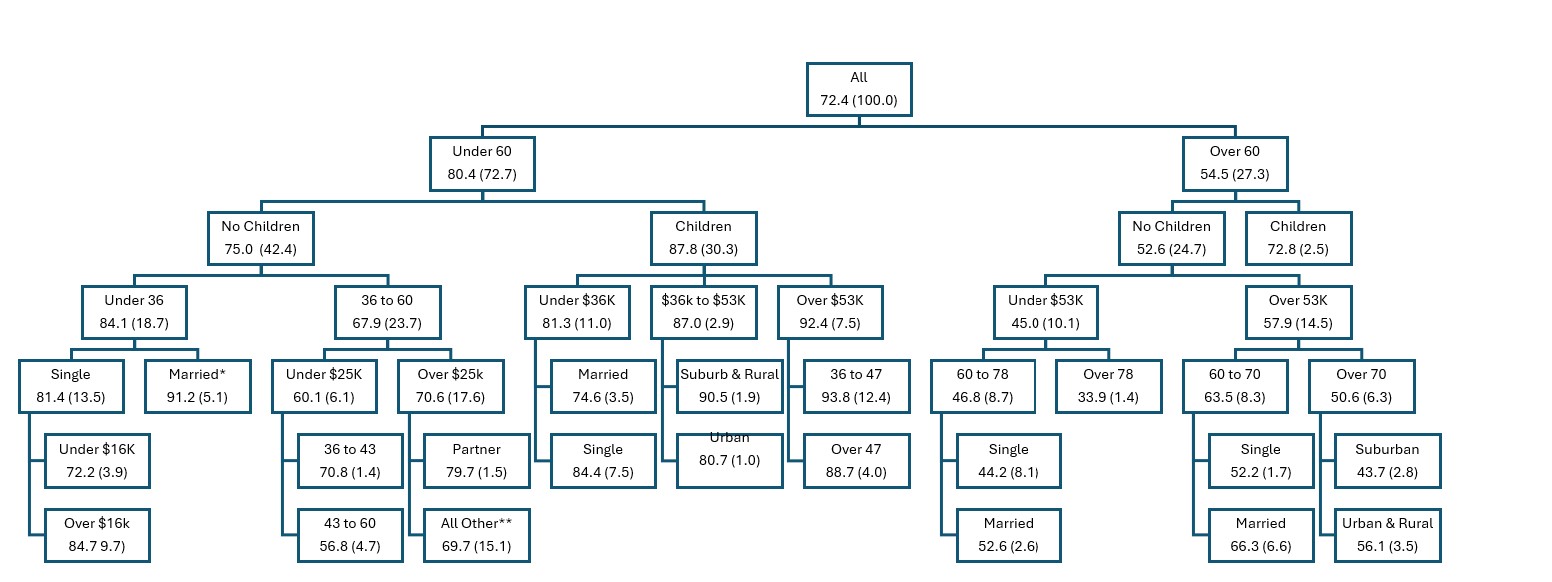
We have put five predictor variables: age, marital status, having children, income and rural/urban/suburban classification together using a classification regression tree, as shown in Figure 4. Age shows household income is by far the most important predictor of celebrators, with the first division at age 60. The highest segment is under 47, having children, with an income over $53,000 and a celebration rate of 93.6% compared to the overall 72.4%. The lowest segment is over 78, with no children and a celebration rate of 33.9%, representing 1.4% of the total population. As indicated by an asterisk, the category of married includes living with an unmarried partner, divorced or separated, widowed, as well as married. The double asterisk indicates all other categories.
Figure 4: Decision Tree Predicting Halloween Celebration

The classification regression tree (CRT)performs well by correctly classifying 74.8% of the sample using a 10-fold cross-validation. Table 15 shows the summary importance of each of the variables impacting the overall 72.4% of respondents who would be celebrating. Age is the overwhelming predictor, followed by marital status (married) and income.
Table 15: CRT Summary
| Variable | Importance | Normalized Percent |
| Age | 3.4 | 100.0 |
| Marital Status | 0.9 | 25.5 |
| Children | 0.8 | 22.4 |
| Income | 0.6 | 18.0 |
| Rural/Urban/Suburban Classification | 0.1 | 2.4 |
| Growing Method: CRT | ||
| Dependent Variable: Celebrate Halloween | ||
Halloween continues to be a significant retail event, engaging a large portion of the population despite economic challenges and shifting spending habits. While the pandemic temporarily reduced participation, the tradition has rebounded, with consumers increasingly turning to online shopping and various sources for inspiration. Costumes, candy, and decorations remain the top spending categories, with inflation contributing to rising costs. Retailers can expect steady consumer interest, but many celebrators are adjusting their spending to accommodate higher prices by reusing items or cutting back in other areas.
