Summary
This article provides insights into the increasing interest in sports betting and its connection to consumer behavior, demographics, and personality traits. Understanding these dynamics is essential for businesses seeking to engage with this growing market.
- The increasing popularity of sports betting, driven by prominent platforms like FanDuel and DraftKings, is explored through data from the 2023 Prosper Media Behavior and Influence (MBI) study, encompassing 17,159 adults aged 18+.
- Two key questions were asked in the study: “Do you gamble on sports?” and “Do you play fantasy sports?” Responses were categorized as regularly, occasionally, or never.
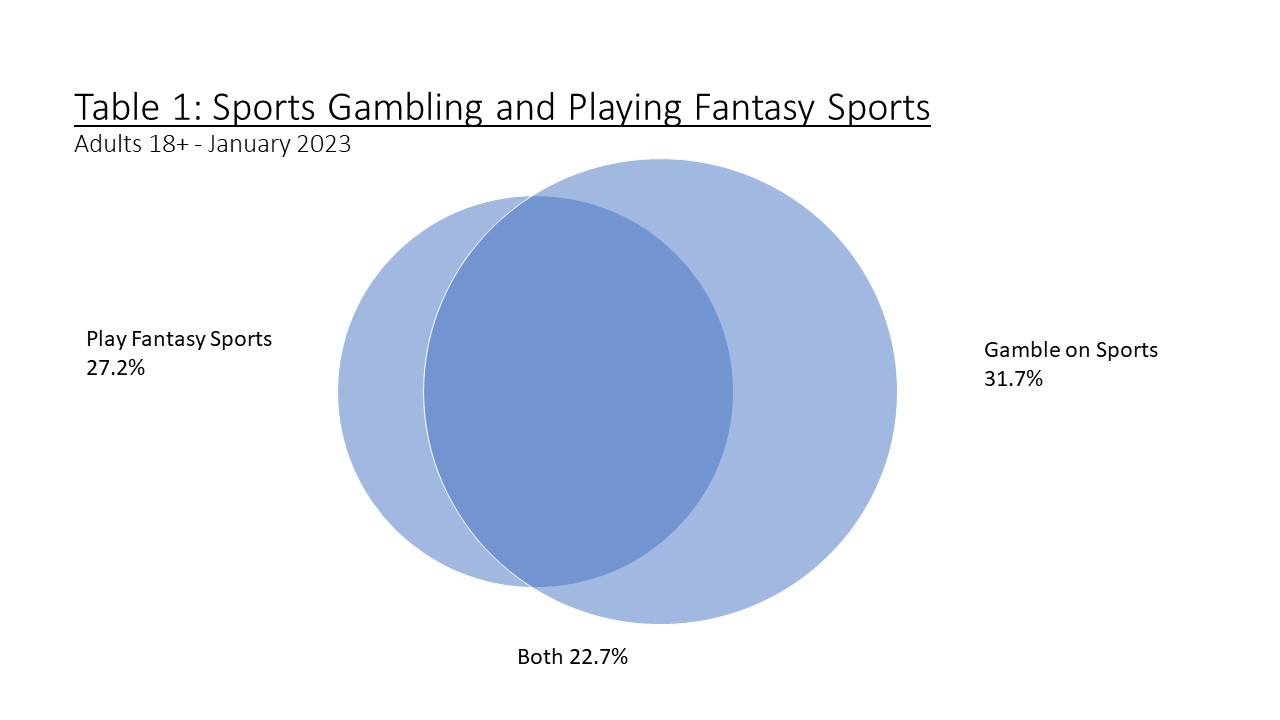
- 31.7% of respondents engage in sports gambling (regularly or occasionally), while 27.2% participate in fantasy sports, with a substantial overlap of 22.7% doing both.
- Within these categories, 71.7% of sports gamblers also play fantasy sports, and 83.4% of fantasy sports participants also gamble on sports.
- Approximately 40% of the 2023 MBI study population resides in states where online sports betting is illegal, despite substantial legal concerns, especially in large states like California and Texas.
- Historical data reveals a steady increase in sports gambling, particularly in recent years, while fantasy sports participation has remained relatively stable.
- In 2023, 42.1% of males reported gambling on sports compared to 21.5% of females, with both genders showing growth over the past three years, albeit at different rates.
- Demographic characteristics reveal higher sports gambling rates among Gen-Z, Millennials, and males, with connections to various occupations and a slight advantage for those with higher education.
- A classification regression tree (CRT) analysis identifies segments with high sports gambling rates, with age, gender, income, marital status, and ethnicity being significant predictors.
- Viewership patterns indicate that gambling on sports is related to specific sports categories, with minor sports and women’s sports exhibiting greater relative interest among gamblers. Additionally, sports bettors are more likely to engage in sports-related activities, favor alcoholic beverages, and display specific personality traits, including high extraversion and lower grit, demonstrating a distinct consumer profile.
Forward
By Dr. Larry DeGaris, Executive Director, Medill Spiegel Research Center, Northwestern University
“Legalized sports gambling is the endgame. One-day fantasy delivers a similar fan experience to gambling, so I expect the current database of customers would provide a good foundation for sports gamblers.” I said this in 2015 when I was interviewed for the Bloomberg article “Daily Fantasy Sites Seen Positioned for Jump to Sports Gambling.”
This interview came on the heels of NBA commissioner Adam Silvers’s 2014 NYT op-ed, “Legalize and Regulate Sports Betting,” advocating legalizing sports betting; I knew it was just a matter of time before sports betting was legalized nationwide and DraftKings and FanDuel were planting the seeds.
Fast forward to 2023, and DraftKings and FanDuel are dominating the sports betting market while big sports brands like Fox and big gaming brands like MGM struggle or fail. I thought it was a good strategy. I didn’t realize how good.
The sports betting market highlights the value of customer data. DraftKings and FanDuel’s market domination is based on their customer data strategy. They bet that fantasy players, especially daily fantasy players, would be the most promising market for sports betting. As sports betting became legal in more states, they were ready. It was a big bet and a big win.
Similarly, brands are placing big bets on Retail Media Networks. The strategy is the same. As we enter the cookie-less world, customer data will become more valuable. That’s no fantasy.
More recently, Fanatics is getting into the sports betting game with its acquisition of Pointsbet, betting that its database of fans will help them compete where others have fallen short. I’m not sure I like the odds. Let’s reverse engineer DraftKings’s and FanDuel’s winning strategy. Martin Block’s nifty little sports betting paper shows us the way.
The relationship between betting on sports and playing fantasy sports is very high. The two groups are almost identical. Unlike the years it took Amazon to build a customer database, DraftKings and FanDuel had theirs built before sports betting became legal. As more states legalized sports betting, they were ready. That initial advantage has been difficult for other entrants to overcome.
Having a database of sports fans doesn’t measure up to a targeted list of fantasy sports players. Similarly, I reckon Fanatics has a great database of fans passionate about their teams, which likewise wouldn’t translate well to betting.
Digging deeper, we see the underlying mechanisms of sports betting and outline a path forward. DraftKings and FanDuel won the first round, but it ain’t over ‘til it’s over.
The women’s market in sports tends to be underserved in general because fan populations are more likely to be male. The difference in degree mistakenly is equated with a categorical difference. Sports bettors are more likely to be male, but there are a lot of women betting on sports.
Sports betting companies have been active as sponsors of sports properties. But sports betting is a fan activity and, as Martin points out, there are many product categories that index high for sports bettors. Creating a brand partnership strategy using sports betting as a platform could bring another revenue stream.
Sports bettors are highly social and competitive. That’s the underlying link between fantasy and betting. Fantasy was a natural connection for sports betting in that respect, but if sportsbooks can innovate ways to connect fans who weren’t playing fantasy, they can gain an entry point. What do you talk about when your team is having a bad year? This week’s parlays. Sports betting is a social experience for fans. Sports betting companies can create a social infrastructure for fans to interact, as they’ve done with fantasy leagues.
The story highlights both the importance and limitations of customer data. Customer data tells you who. Traditional market research can help understand the why.
We should keep this in mind as we watch retail media grow. First-party customer data is tremendously valuable but limited without a deeper understanding of shopper experiences and identities.
Sports Betting
By Dr. Martin Block, Professor Emeritus, Northwestern University, Retail Analytics Council
Interest in sports betting is increasing with the publicity that FanDuel and DraftKings have recently enjoyed. To better understand sports betting data from the annual Prosper Media Behavior and Influence (MBI) study collected in January of 2023 (n=17,159) of adults 18+ is analyzed. Two questions were asked: “Do you gamble on sports?” and “Do you play fantasy sports?” Both questions were supplied with answer options of regularly, occasionally, and never. Table 1 shows the proportion of the sample that gamble on sports combining regularly and occasionally at 31.7%, and those playing fantasy sports at 27.2%. There is substantial overlap between gambling and fantasy sports, with 22.7% reporting both. Of those who gamble, 71.7% say they also play fantasy sports. Of those who play fantasy sports, 83.4% say they also gamble. Not all respondents say they gamble and play exclusively online. Of those who say they gamble on sports, 66.0% say they also gamble online. Of those who play fantasy sports, 84.1% say they also play fantasy sports online.
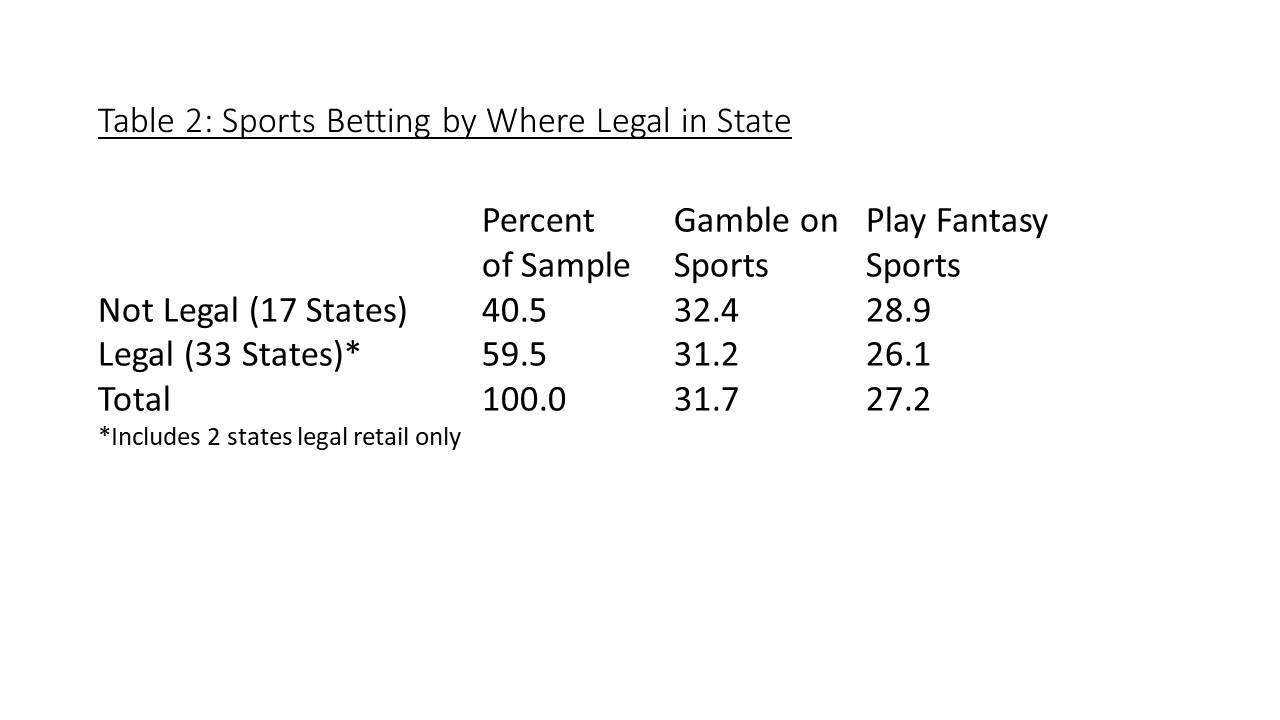
The legality of online sports betting has also been a topic of interest. Using FanDuel’s map of states where the service is legal, Table 2 shows that approximately 40% of the population as represented by the 2023 MBI are in states where it is not legal. Two big states, California and Texas are among the states where it is not legal. It should be noted that in states where it is not legal, the proportion is slightly higher than in states where it is legal. The difference, despite the very large sample sizes, is not statistically different. Legalizing online sports betting appears to have little influence.
 Historical Background
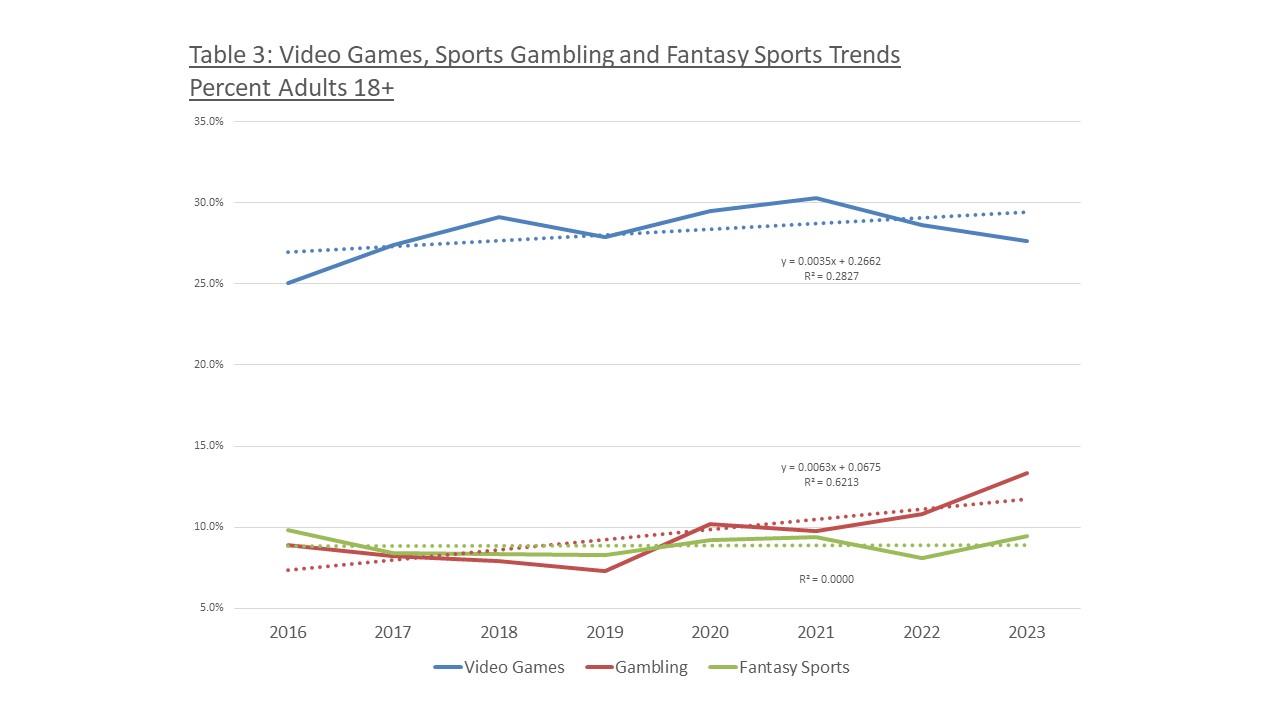
The gambling and fantasy sports questions have been asked in the MBI for several years. Table 3 shows the trends over the last eight years for gambling, playing fantasy sports, and playing video games. Playing video games has slowly increased over the years but is showing a slight decline in 2023. Gambling on sports has steadily increased, especially in recent years. Playing fantasy sports has remained almost perfectly flat.
Considering just the last three years, as shown in Table 4 illustrates the recent growth, especially for 2023. It also shows a comparison of gambling by gender. In 2023, 42.1% of males reported gambling on sports compared to 21.5% of females. The average annual growth rate for males over the three years is 3.9%, compared to 4.0% for females.
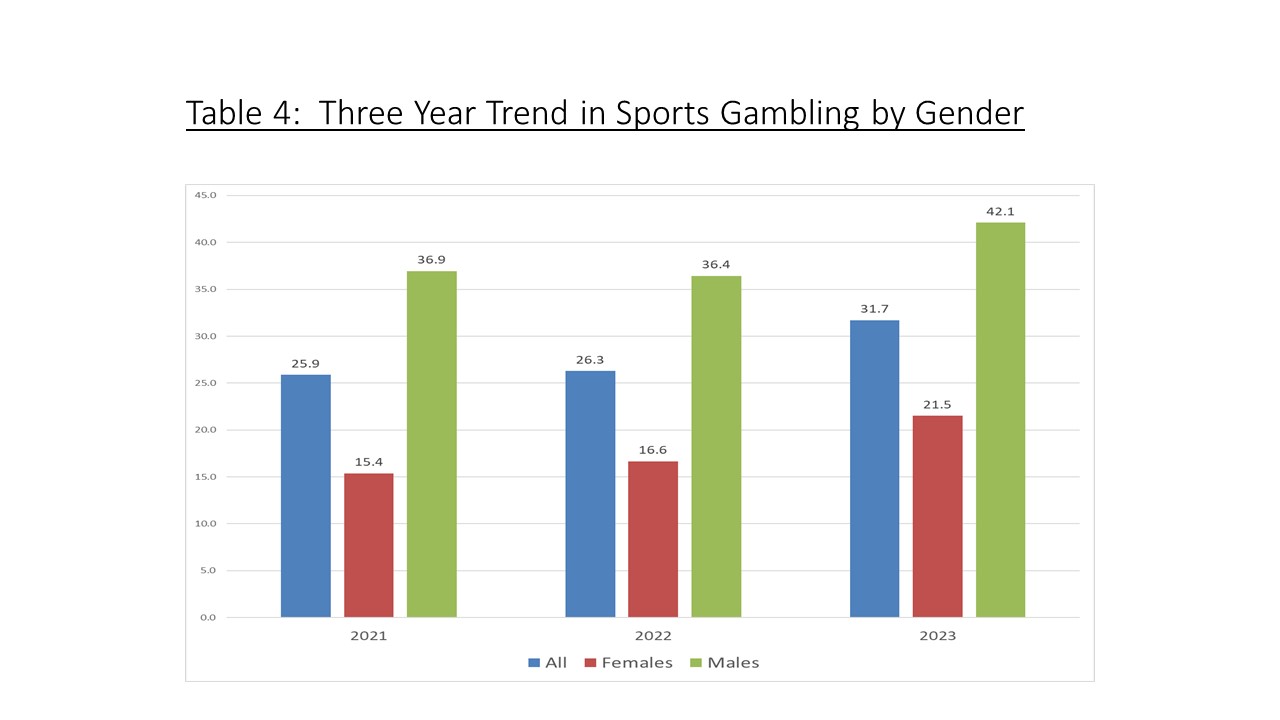
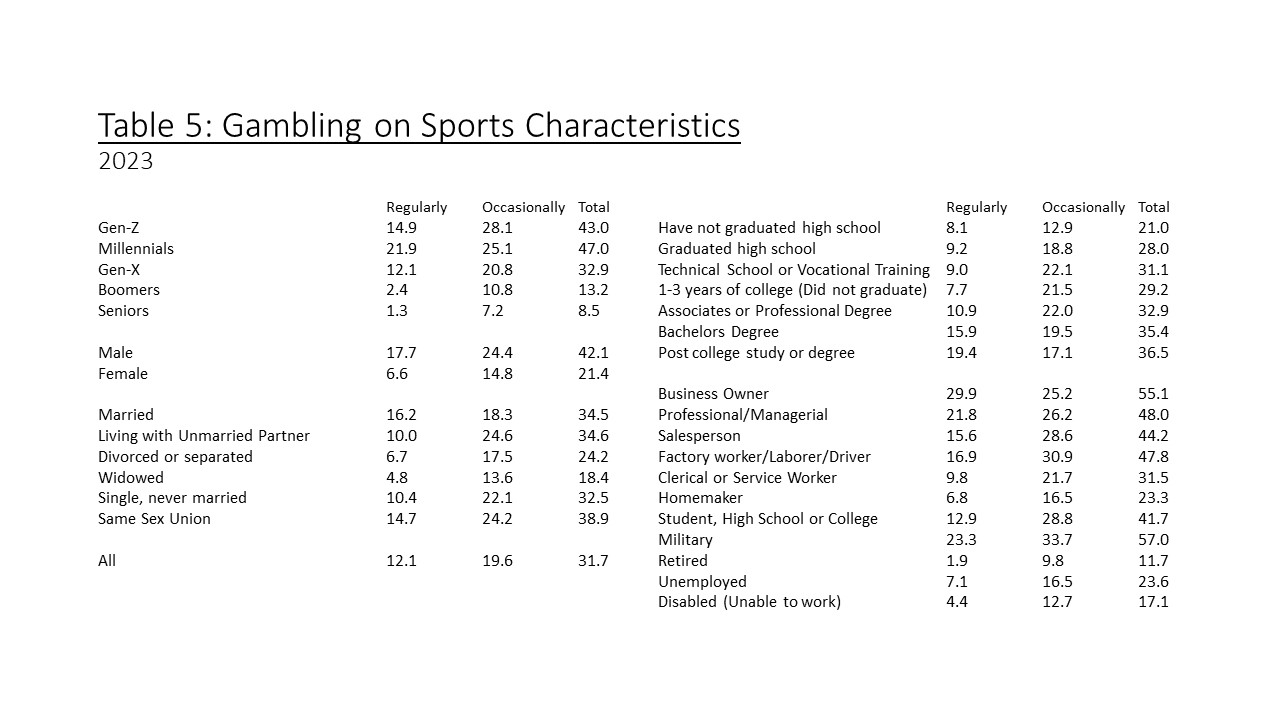
Table 5 shows some differences by various demographic characteristics and the breakdown by regularly and occasionally gambling on sports. Looking at the characteristic variables by themselves, it appears that sports gambling is highest among Gen-Z, Millennials, and males. There seems to be strong connections to occupation, especially business owners, professionals, salespersons, workers, students, and military. All these occupations have a social component. There is also a slight advantage for higher or more education.
Identifying the Sports Bettor
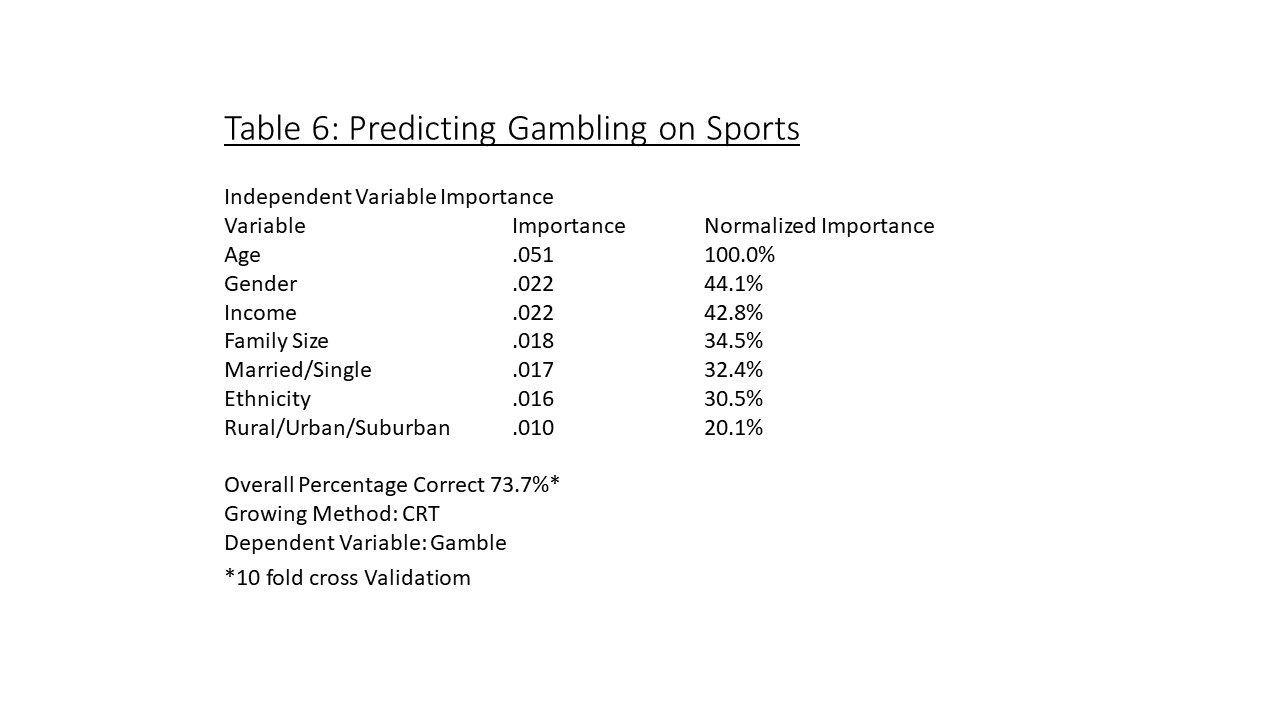
Using a classification regression tree (CRT) to predict gambling on sports allows for the identification of consumer segments that have high rates of gambling on sports. Table 6 shows the results of such analysis and the important predictor variables. The most important predictor, by far, is age. This is followed by gender, income, family size, marital status, ethnicity, and population density. The model itself is reasonably strong, predicting a bettor 73.7% of the time using 10-fold cross-validation.
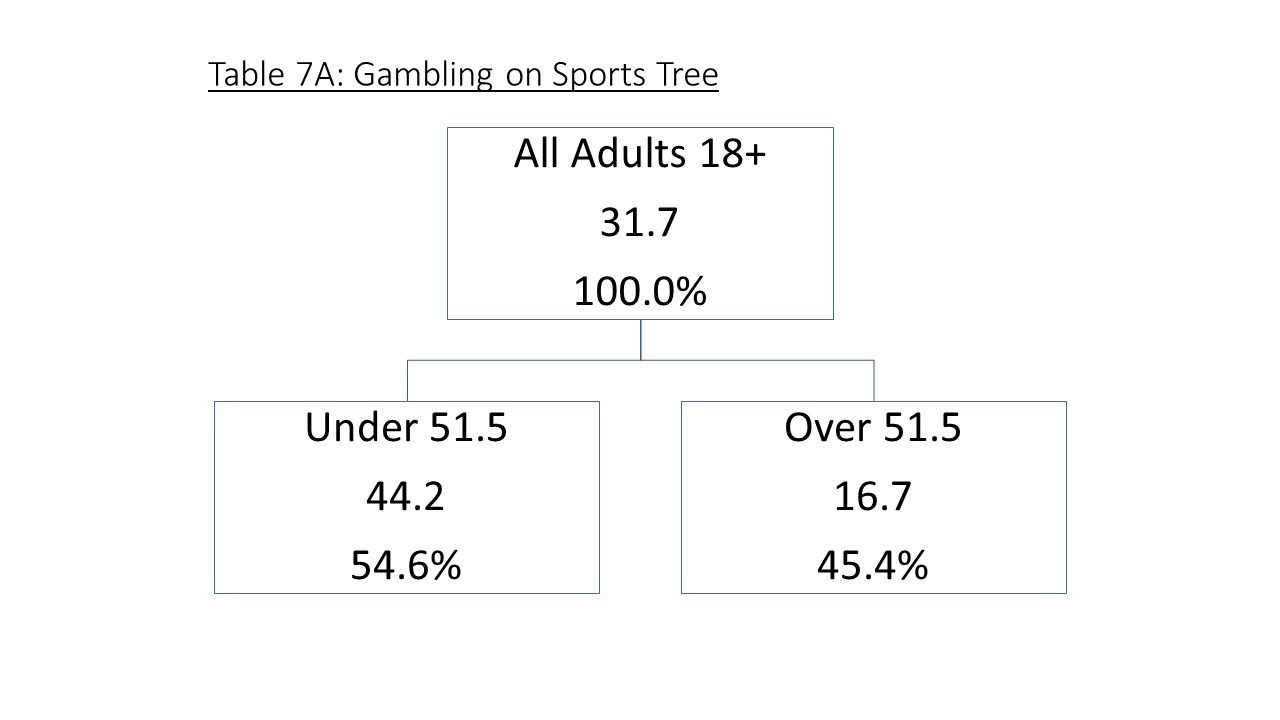
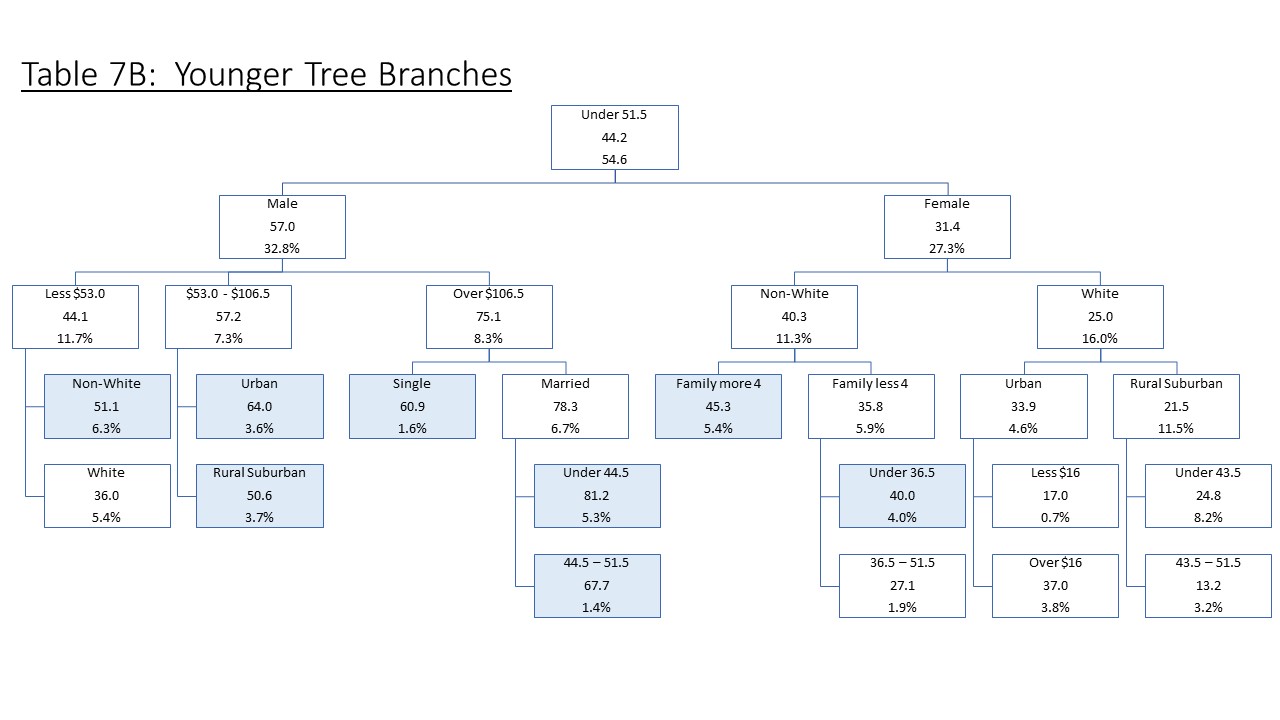
The tree itself identifies the segments as terminal nodes, as shown in Table 7. The highest node, those under 44, male, incomes over $106.5K, and married report 81.2% betting on sports and comprise 5.3% of the total population of adults. Slight older, ranging from 44 to 51, report 67.7% betting. Under 51, males, over $1065k and are single (never married) report 60.9% and comprise 1.6% of adults. Males under the age of 51 with incomes between $53k and $106K living in an urban area report 64.0%, and males in suburban and rural areas report 50.6%. Males under the age of 51 with incomes less than $53K, who are non-white report 51.1% gambling on sports and comprise 6.3% of the total population. These are all the male segments above 40% of sports gambling.
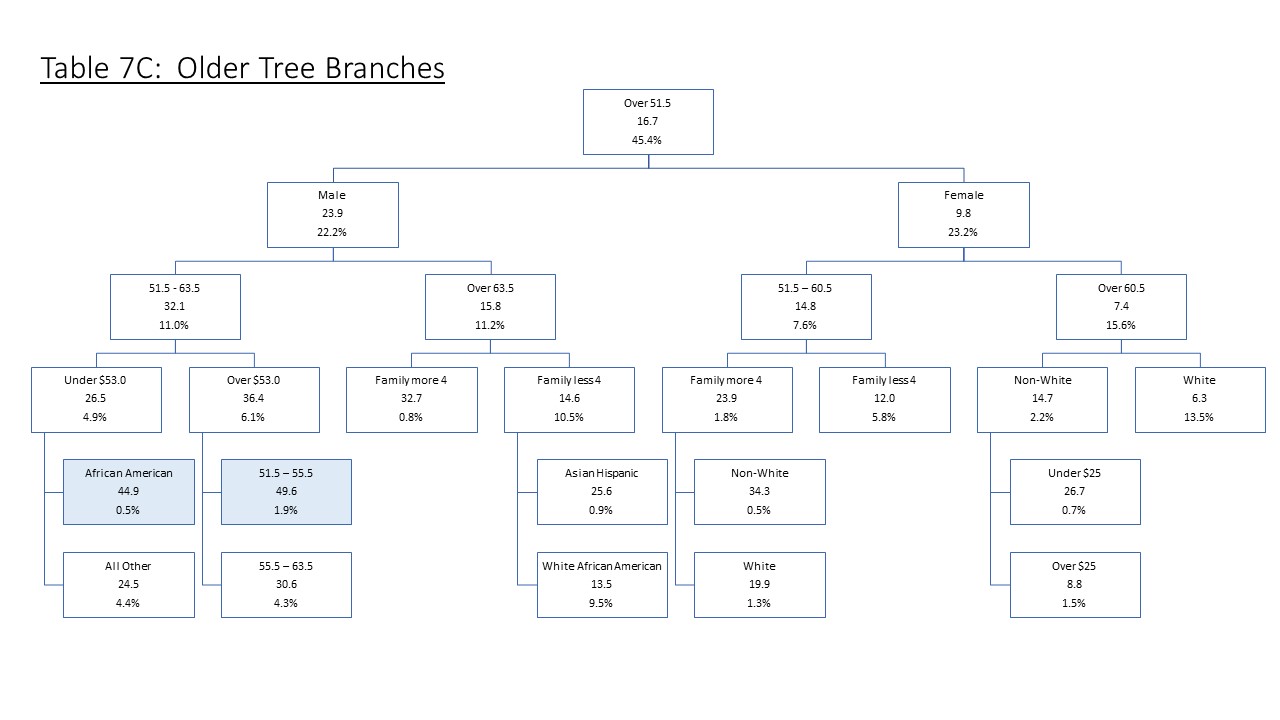
The female side of the tree shows non-white with a family size of four or more at 45.3%, comprising 5.4% of the total sample. Non-white females, with a family size of less than four, and younger than 36 report 40.0% gambling and comprise 4.0% of the total sample. Among the older segments are males earning over $53K, aged 52 to 55, reporting 49.6% gambling, and African American males earning under $53K, aged 52 to 63, reporting 44.9% gambling.
Sports Program Viewing
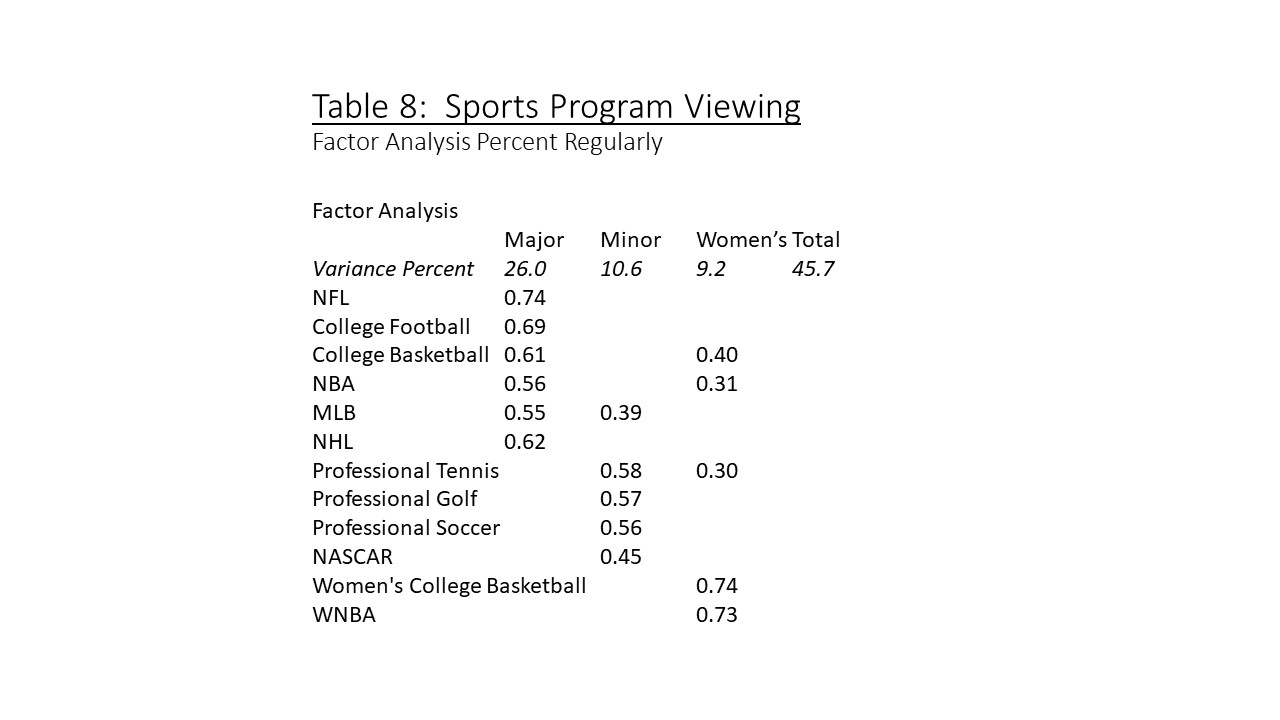
Respondents were asked if they regularly viewed 12 different sporting events. To establish a pattern, the 12 were factor-analyzed (principal component) as shown in Table 8. The viewing patterns are arranged in three groups labeled “major,” which includes the NFL, college football, and other team sports of broad interest. The analysis shows that those who report viewing the NFL are also likely to watch college football. The second group, labeled “minor,” includes professional tennis and golf and have a narrower level of interest and are not thought of as team sports. The third group is labelled “women’s” for woman’s sports..”
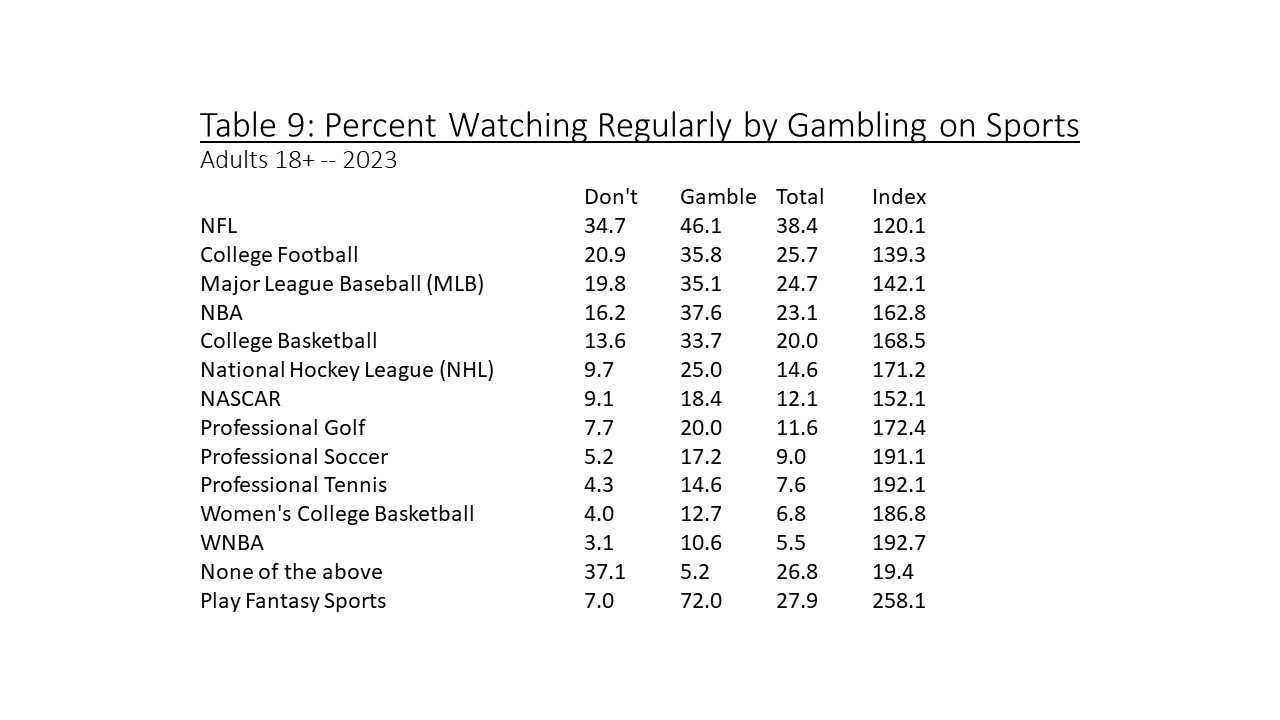
Relating the viewing to gambling on sports is shown in Table 9. Overall, 73.2% of adults report viewing at least one of the categories of sports programming. The NFL is viewed by 38.4% of adults, followed by college football, major league baseball, and the NBA. Sports betting is certainly related to viewing, as in the case of the NFL, where 46.1% of the viewers compared to 34.7% of the viewers do not gamble, providing a gambling index of 120.1. The major sports have an average index of 150.7, minor sports have an average index of 176.9, and women’s sports have the highest average index of 189.8. Minor, less team-oriented sports, and especially women’s sports, are of greater relative interest to gamblers.
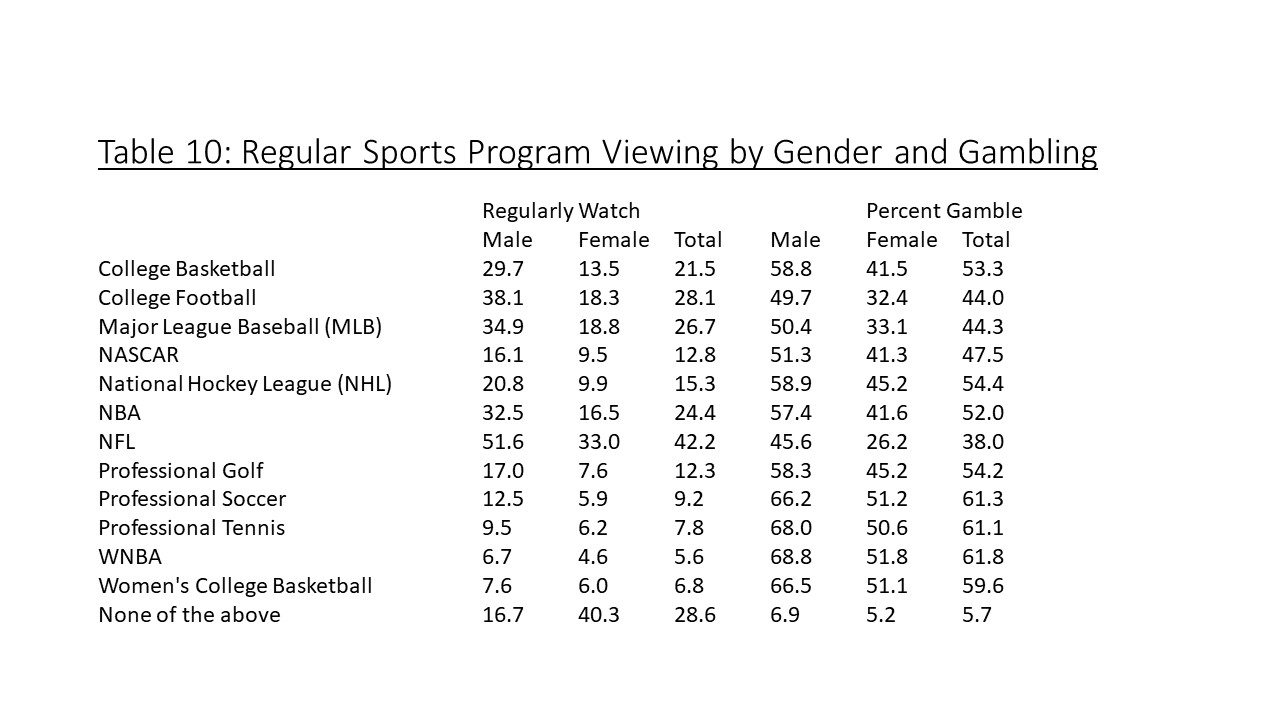
 Female viewing across all 12 categories is lower than male viewing, as shown in Table 10. The difference between the genders diminishes with viewing of women’s sports. The gambling percentage also increases, especially for minor sports for both genders. Interest in gambling on sports seems to be related to the viewing of minor sports.
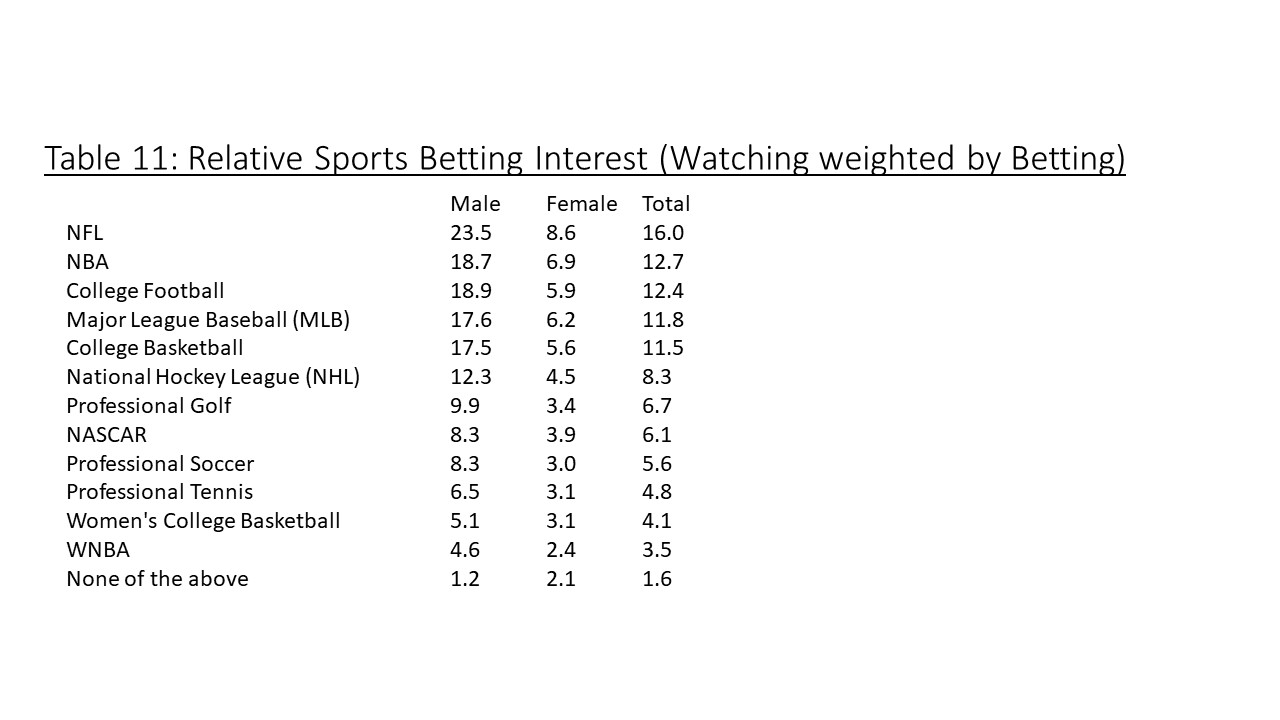
Weighting sports betting by regular viewing demonstrates the relative interest in the sports category, as shown in Table 11. The NFL overall leads sports betting activity, followed by the NBA, college football, major league baseball, and college basketball. All these categories are team-oriented and of broad interest.
Activities
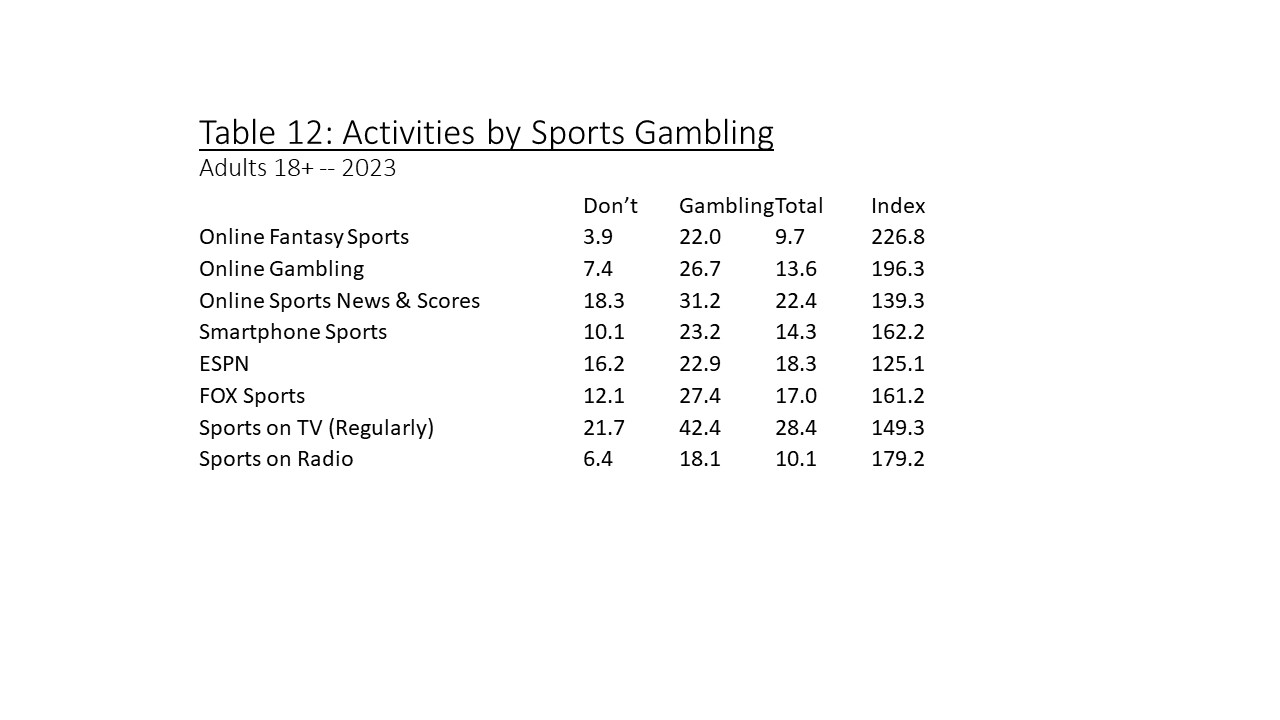
Those who report gambling on sports are more likely to engage in a variety of sports-related activities, as shown in Table 12. Engaging in online fantasy sports and online gambling index at almost double. Sports on the radio and smartphones are higher than regularly watching sports on TV. Fox Sports indexes higher than ESPN.
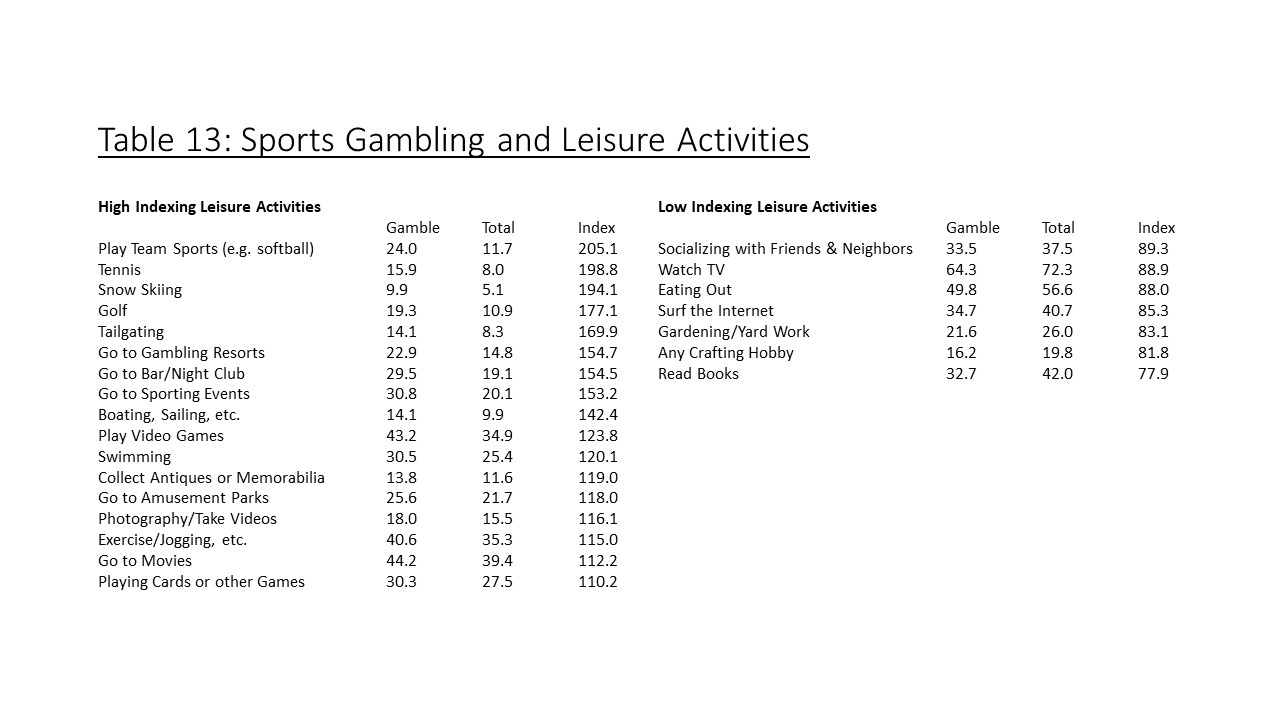
Respondents were also asked about 31 different leisure activities, which are compared to reported gambling on sports, as shown in Table 13. The highest indexing activity is playing team sports. Also high are very active categories such as tennis and snow skiing. Social activities, such as tailgating and going to gambling resorts, bars, and sporting events are also high. The image of sports betting is being social, interested in competition, and physically active. On the other hand, those indexing low is generally passive and perhaps a bit more solitary, reporting activities such as watching TV, surfing the internet, crafting hobbies, and reading books. Those activities are indexed at nearly the same (not shown) as going shopping, online communities, and travel.
Product Consumption
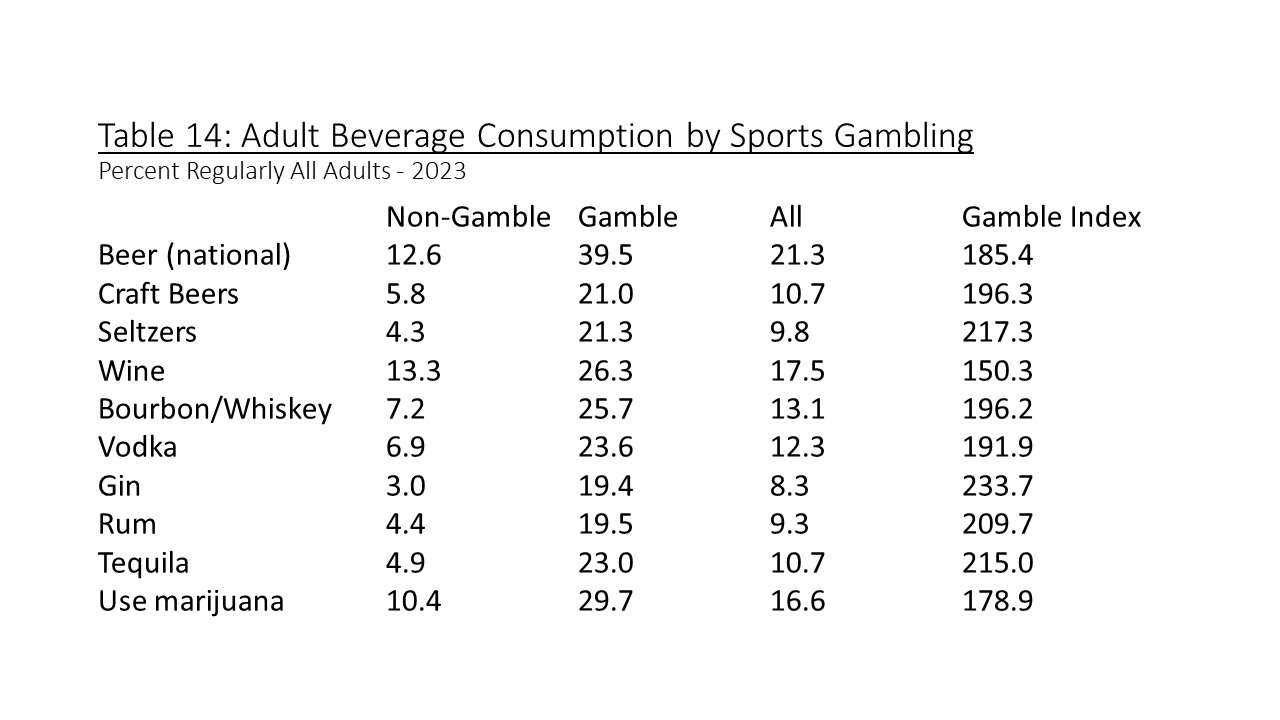
Consumption of alcoholic drinks is commonly associated with viewing and gambling on sports. Table 14 shows this to be true as most categories of drinks index at almost double among those that gamble. The lowest index is wine.
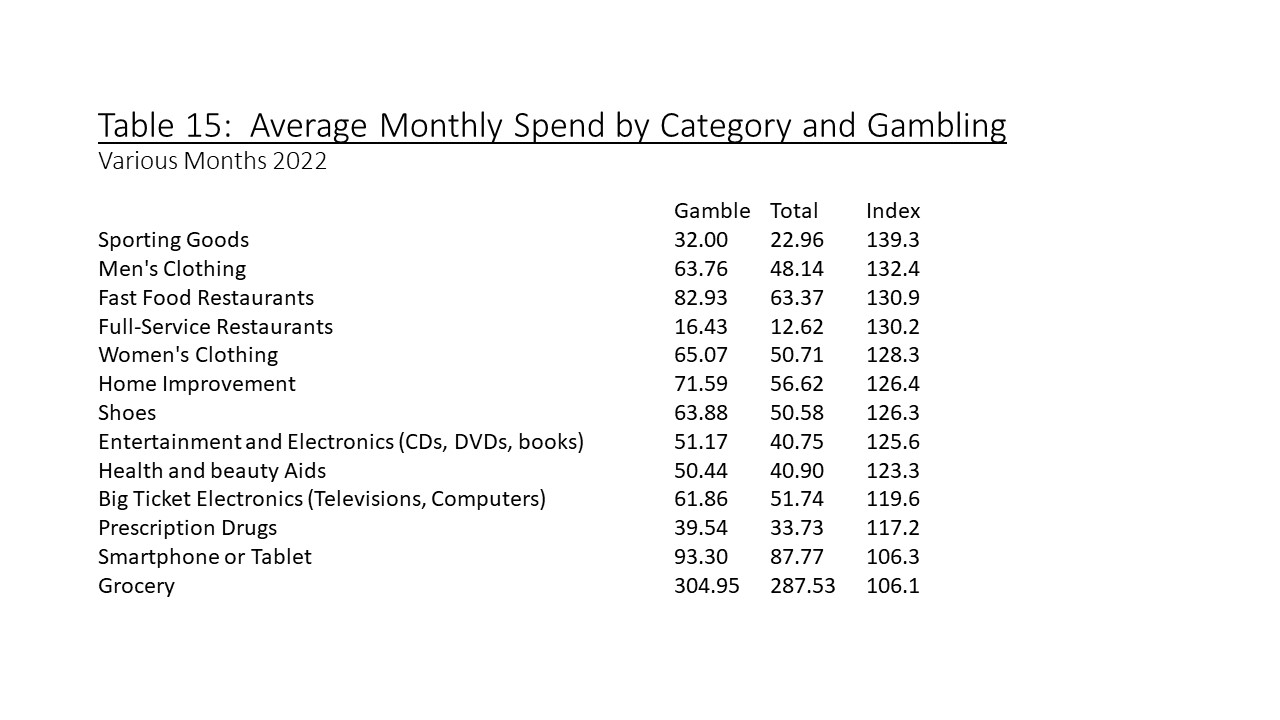
Average monthly product spending is collected monthly, with the categories rotating across different months. The data from the monthly surveys (average n=7,500) needs to be integrated with the annual MBI, which is done using decision tree equations from available demographic variables common to both the monthly and MBI studies. Shown in Table 15 are the average reported household monthly spending across a variety of product categories. The months are taken from 2022 prior to the 2023 MBI. The averages include zero if the respondent reports no spending in that category. The highest indexing category is sporting goods, followed by men’s clothing and both fast food and full-service restaurants. It is worth noting the home improvement spending indexes highly note the characteristics of the sports gambler. Smartphone and grocery spending is almost the same. Overall, those who gamble on sports spend more on average than those who do not.
Personality
Several personality measures were also collected in the MBI including the five-factor personality inventory commonly referred to as OCEAN, grit, and impulsiveness. The personality inventory used by Prosper in the MBI is taken from the short-form version developed by the Gosling Laboratory at the University of Texas. The five factors include:
- Extraversion: Extraversion is characterized by excitability, sociability, talkativeness, assertiveness, and high amounts of emotional expressiveness. People who are high in extroversion are outgoing and tend to gain energy in social situations. People who are low in extroversion (or introverted) tend to be more reserved and must expend energy in social settings.
- Agreeableness: This personality dimension includes attributes such as trust, altruism, kindness, affection, and other prosocial behaviors. People who are high in agreeableness tend to be more cooperative, while those low in this trait tend to be more competitive and even manipulative.
- Conscientiousness: Standard features of this dimension include high levels of thoughtfulness, with good impulse control and goal-directed behaviors. Those high on conscientiousness tend to be organized and mindful of details.
- Neuroticism: Neuroticism is a trait characterized by sadness, moodiness, and emotional instability. Individuals who are high in this trait tend to experience mood swings, anxiety, moodiness, irritability, and sadness. Those low in this trait tend to be more stable and emotionally resilient. This trait is sometimes inversely reported as “emotional stability.” The Prosper database uses the “emotional stability” terminology.
- Openness: This trait features characteristics such as imagination and insight, and those high in this trait also tend to have a broad range of interests. People who are high in this trait tend to be more adventurous and creative. People low in this trait are often much more traditional and may struggle with abstract thinking.
Table 16 shows a comparison of sports gamblers by the five personality traits. All five are statistically different. The biggest differences are gamblers are more competitive and more extravagant with less impulse control. Gamblers also have higher sociability, are more traditional, and are less likely to think abstractly. They are also more emotionally stable and resilient.
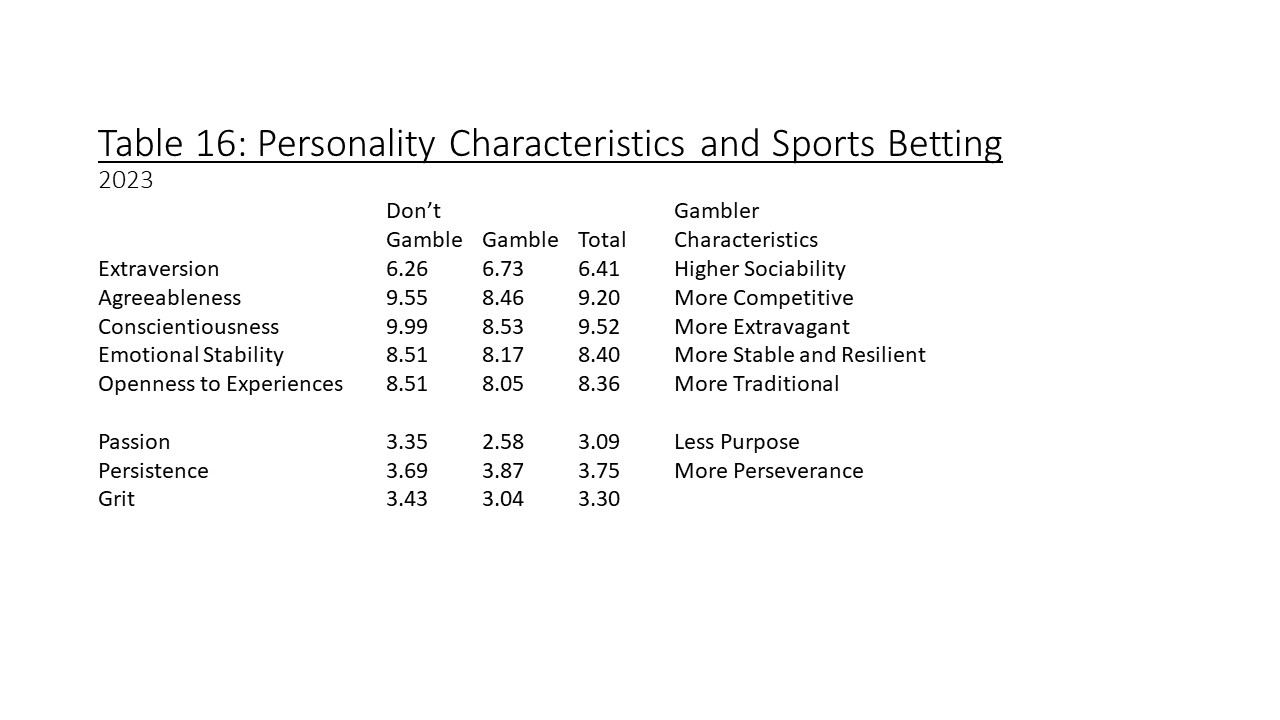
A non-cognitive predictor of success in life, such as grit, like having a clear inner compass that guides all your decisions and actions. Grit is defined as the disposition to demonstrate perseverance and passion for long-term goals (Angela Duckworth, Grit: The Power of Passion and Perseverance, Scribner, 2016). Passion is a deep, enduring knowledge of what you want. Perseverance is hard work and resilience. All three predictors are expressed as a five-point scale, with higher values being stronger on the characteristics developed from a series of five-points. Prosper used the short-scale version.
Again, shown in Table 16 is the comparison of sports gamblers. All the differences are statistically different. Gamblers have lower overall grit, meaning they are less oriented toward long-term goals. The biggest difference for gamblers is lower passion, that is knowledge of what they want. Gamblers are higher in perseverance.
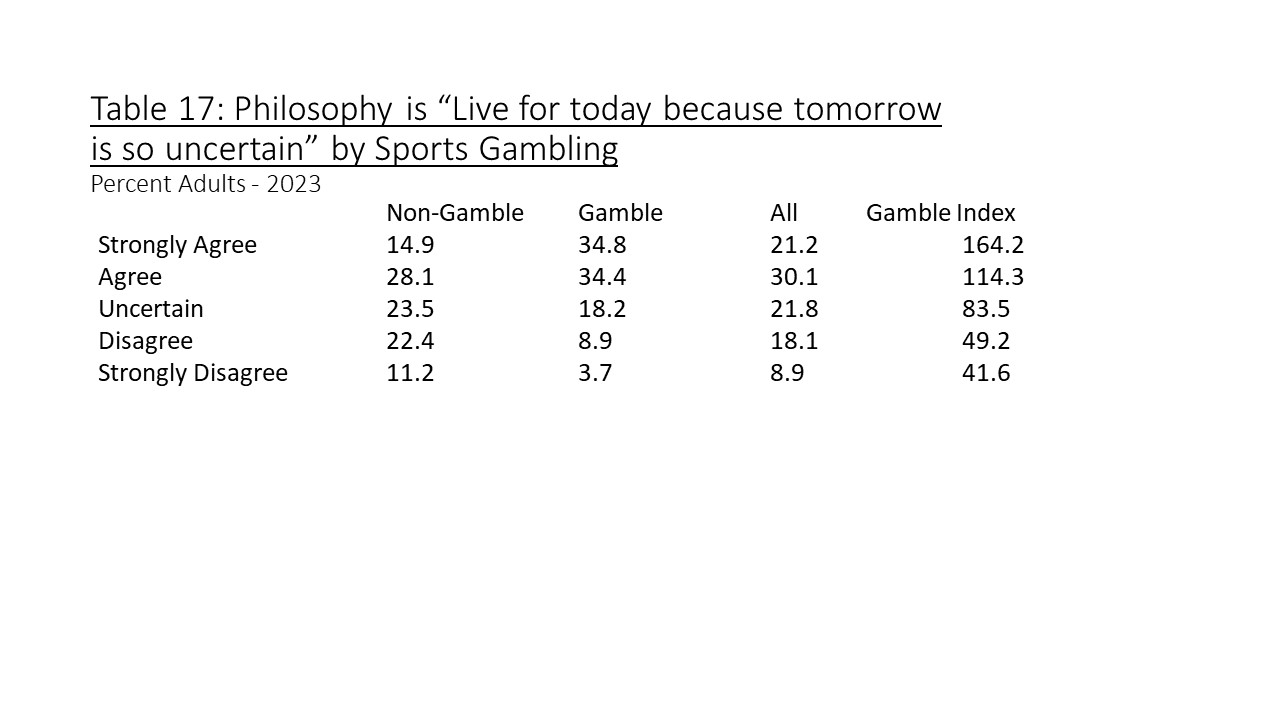
Impulsivity, as measured by agreement with the statement “Live for today because tomorrow is so uncertain,” also demonstrates a difference among gamblers, as shown in Table 17. Gamblers are much more likely to strongly agree with the statement and, conversely, strongly disagree. This reinforces the lack of long-term orientation among gamblers.
The Prosper Media Behavior and Influence study from January 2023 unveils the rising interest in sports betting, emphasizing the convergence of sports gambling and fantasy sports. The analysis explores demographic predictors, revealing age, gender, income, and marital status as key factors influencing sports betting engagement. Furthermore, the study uncovers correlations between sports program viewing, personality traits, leisure activities, and product consumption, painting a comprehensive picture of the diverse profile of sports gamblers.