Summary
St. Patrick’s Day ranks between Halloween and Valentine’s Day. Celebrating the day has increased over the last nine years. Spending is also up, especially for food and beverage. Gender, age, income, and presence of children are the strongest predictors of planning to celebrate. Celebrators plan to buy more and shop more. They are more likely to shop online as well. St. Patrick’s Day celebrators are also happier than those who don’t plan to celebrate.
- Patrick’s Day celebrations have increased to 61.9%, ranking between Halloween and Valentine’s Day.
- Celebration rates have steadily risen over the past eight years, rebounding from a dip in 2021 likely attributed to COVID-19.
- The survey delves into planned spending, with food and beverages dominating and most spending occurring in grocery or discount stores.
- The St. Patrick’s Day celebrator profile is explored, indicating that younger individuals exhibit higher celebration rates, especially males under 38 and younger females with children.
- Planned spending has consistently increased, with an average spend of $48.37 for those planning a party in 2024.
- Online shopping is prevalent among celebrators, surpassing non-celebrators in various product categories.
The article concludes by noting that those planning to celebrate St. Patrick’s Day tend to be happier across various aspects of life compared to non-celebrators.
St. Patrick’s Day Celebrations Soar in Popularity and Spending, Revealing Key Trends and Insights
By Dr. Martin Block, Professor Emeritus, Northwestern University, Retail Analytics Council
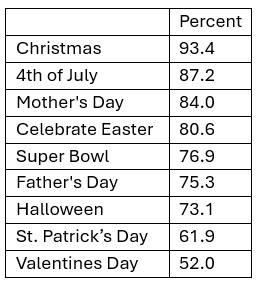
St. Patrick’s Day has become a popular American holiday of the culture. St. Patrick’s Day is among the topics covered by Prosper Insights & Analytics (www.ProsperInsights.com), which conducts monthly online surveys that collect data about annual events and related market behavior. St. Patrick’s Day celebration was asked in the February 2024 survey (n=8,724). In response to the question, “Will you celebrate St. Patrick’s Day this year, 61.9% of all adults said yes. As shown in Table 1, St. Patrick’s Day ranks between Halloween and Valentine’s Day.
Table 1: Seasonal Holiday Participation
Recent St. Patrick’s Day History
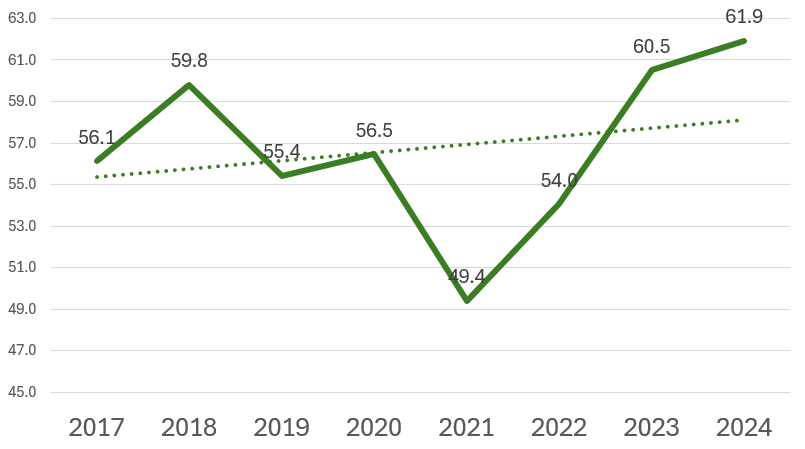
The rate of anticipated celebration of St. Patrick’s Day has increased slightly over the past eight years, as shown In Figure 1. The rate dropped in 2021, no doubt related to COVID-19, and has increased steadily since.
Figure 1. St. Patrick’s Day Celebration Trends
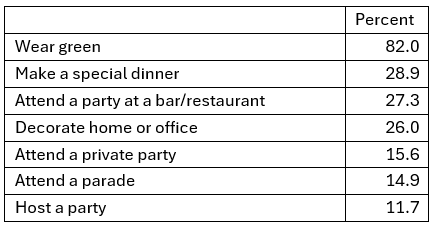
Plans for celebrating St. Patrick’s Day are shown in Table 2. Wearing green is the leading activity, followed by dinners, social activities, and parties. Decorating a home or office is reported by 1 in 4, with attending a parade well down the list.
Table 2: Celebration Plans
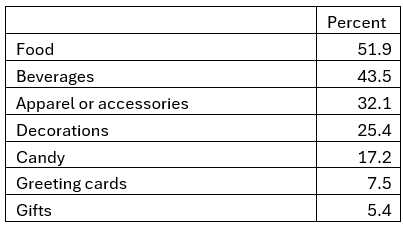
Food and beverage dominate spending plans among those celebrating St. Patrick’s Day, as shown in Table 3. Apparel or accessories and decorations are second to edibles. Greeting cards and gifts are relatively unimportant compared to other holidays.
Table 3: Planned St. Patrick’s Day Spending
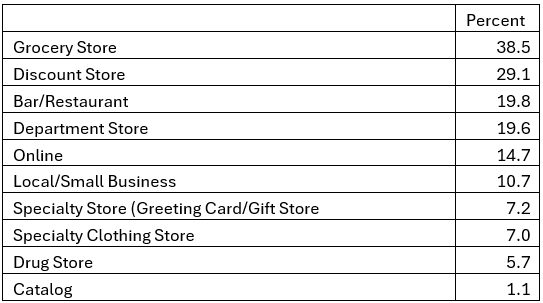
As shown in Table 4, the majority of the planned spending will be in a grocery or discount store.
Table 4: Where Will St. Patrick’s Day Spend Occur
St. Patrick’s Day Celebrators
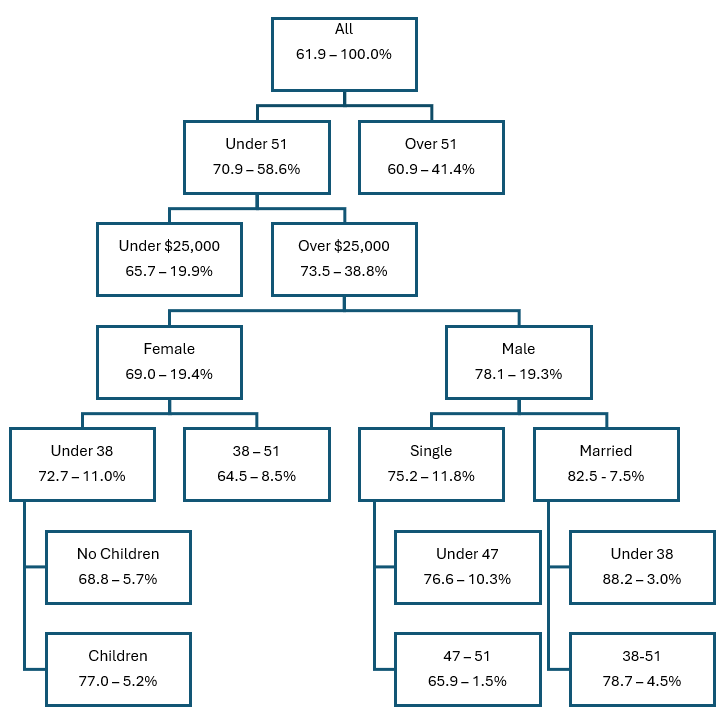
A classification regression tree (CRT) is a reasonable way to determine some of the characteristics of the St. Patrick’s Day celebrator. Using the overall proportion of 61.9%, gender, age, income, and the presence of children are used to estimate the relative proportion in a tree. Figure 2 shows the first split by age, under 51 at 70.9% and over 51 at 60.9%. The tree is pruned, eliminating the nodes with lower-than-average celebration rates. The next split is income, with over $25,000 reaching 73.5%. Males, especially those married and under 38, represent the highest node at 88.2%. Younger females under 38 are also quite high, especially those with children, at 77.0%.
Figure 2: St. Patrick’s Day Celebrators Segmentation Tree
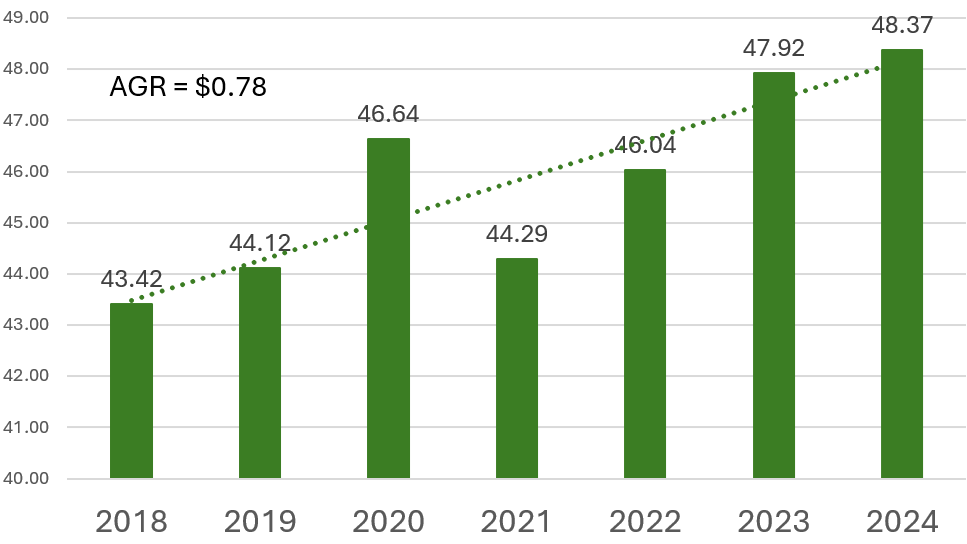
The planned spending has steadily increased, as shown in Figure 3. The 2024 average spend for those planning a party is $48.37, with an average annual growth rate of $0.78.
Figure 3. Average Planned Spend
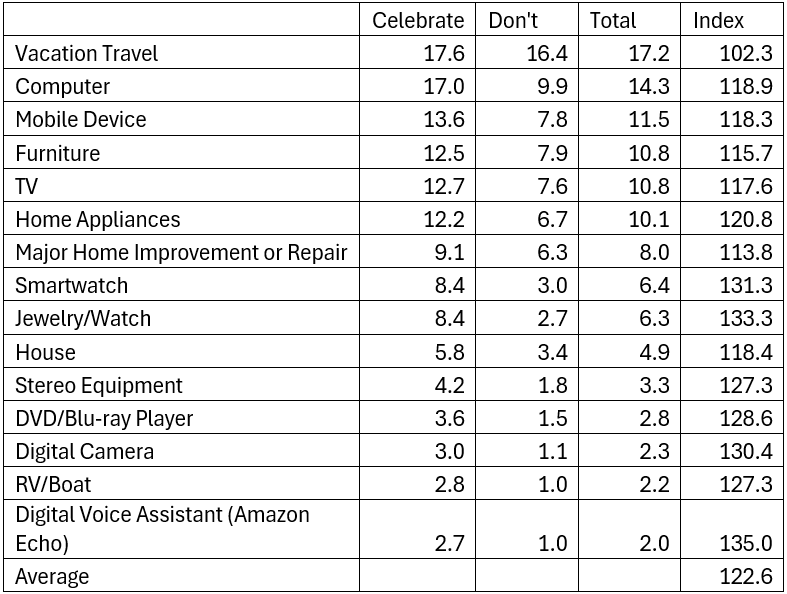
Respondents were asked if they planned any major purchases within the next six months, compared to those planning to celebrate St. Patrick’s Day, as shown in Table 7. An index is calculated comparing the proportion planning a purchase among those celebrating St. Patrick’s Day to all adults. In every category, the celebrators out-plan the overall with an average index of 122.6. Digital voice assistants show an index of 135.0.
Table 5: Purchase Plans in the Next 6 Months, 2024
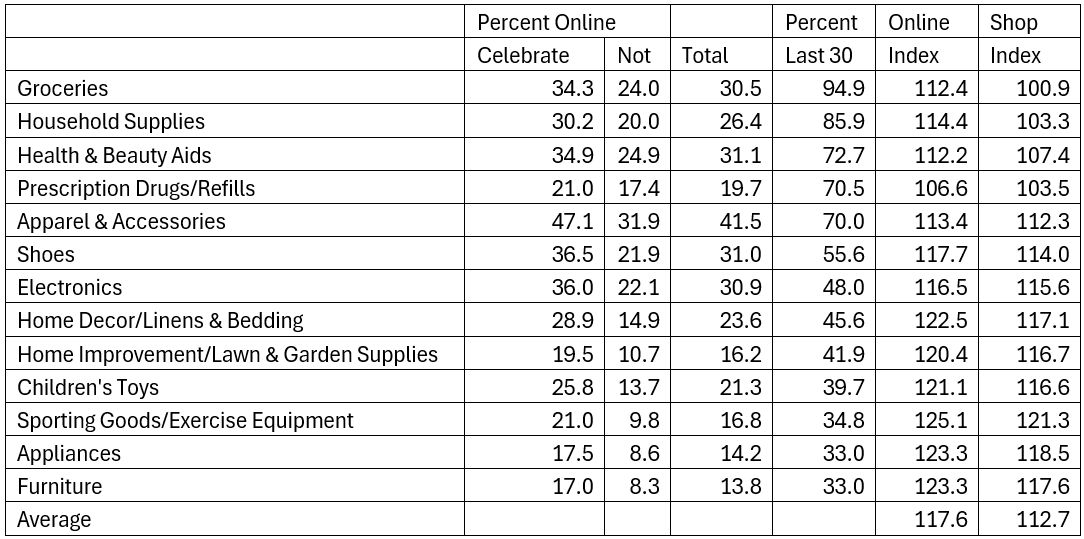
Respondents were asked where they have shopped in the last 30 days by product category. They were asked if they shopped in a physical store, online using a computer, and online using a mobile device. Table 6 shows the comparison between celebrators and online shopping aggregating computers and mobiles. Using groceries to explain the table, 34.3% of celebrators shopped online compared to 24.0% of non-celebrators. This translates to 30.5% of all adults shopping for groceries online. Almost all, 94.9%, shopped for groceries in the last 30 days. This allows the calculation of an online shopping index as well as shopping in the category index. The overall average shows an index of 112.7 for shopping among celebrators and an index of 117.6 for shopping online. Celebrators not only shop more, but they are also more likely to shop online.
Table 6: Product Purchasing Last 30 Days by St. Patrick’s Day Celebration
Happiness
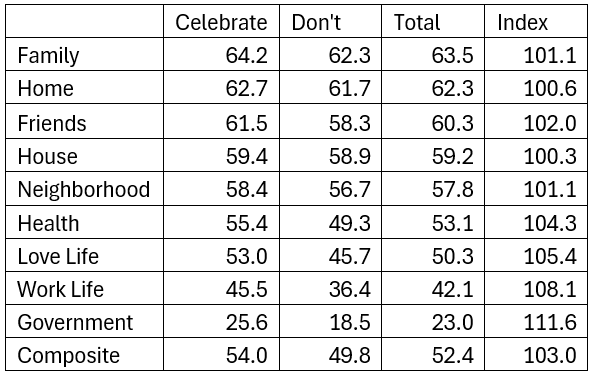
Respondents are asked to rate their overall happiness across ten categories on a five-point scale. Table 7 shows the proportion of the combination of happy and totally happy. The unmistakable conclusion is that those who plan to celebrate St. Patrick’s Day are happier than those who do not, as shown in the composite average. The biggest differences are in health, love life, work life and government.
Table 7: Happiness by St. Patrick’s Day Celebration
“Parades, packed bars, and wearing green are all public spectacles. What is interesting about these data is the scale of private celebrations at home with corned beef and cabbage. It’s not at the scale of Thanksgiving, and it’s not turkey, but it’s not far off,” said Larry DeGaris, Executive Director of Medill Spiegel Research Center, Northwestern University. “Retailers will be moving trailers of corned beef and cabbage, and they should be prepared for the upward trend.”