Executive Summary:
Memorial Day and graduation celebrations significantly influence consumer behavior, with many adults participating in related activities and spending. Participation in Memorial Day sales has slightly increased, while graduation celebrations have slightly declined. Spending on graduation is rising, although the number of gifts per celebration is decreasing. Key predictors of participation include the presence of children, age, marital status, and income.
Key highlights include:
- Millennials and those with higher incomes.
- Women are slightly more likely to participate than men.
- Memorial Day sales participants report higher happiness levels across various aspects, especially health and love life.
- 6% of adults report celebrating graduations, with 18.0% celebrating one graduate, 8.2% two graduates, and 7.4% three or more.
- There has been a slight decline in graduation celebrations over the last eight years, with an average annual decrease rate (AGR) of -0.72%.
- The planned average spending for graduation gifts in 2024 is $116.97, gradually increasing.
- Cash remains the most popular gift, followed by greeting cards and gift cards.
- Both Memorial Day sales participants and graduation celebrators report higher levels of happiness compared to non-participants.
Retail Trends and Spending for Memorial Day and Graduation
Dr. Martin Block, Professor Emeritus, Northwestern University, Retail Analytics Council
Memorial Day (Monday, May 27, 2024) is a popular shopping day ranking just below Valentine’s Day, with about half of adults 18 and older indicating they are either likely or very likely to take advantage of special sales and promotions over the weekend. About one-third indicate they are celebrating graduation. Celebrating graduations and taking advantage of Memorial Day sales are among the topics covered by Prosper Insights & Analytics (www.ProsperInsights.com) in the monthly online surveys that collect data about annual events and related market behavior. Celebrating graduation and Memorial Day were asked in the May 2024 survey (n=8,580). Taking advantage of Memorial Day sales ranks ahead of back-to-school sales (2023) and well behind Thanksgiving weekend sales, as shown in Table 1. Thanksgiving weekend (2023) includes those who say they will take advantage and those reporting maybe.
Table 1. Seasonal Holiday Participation
| Percent | |
| Christmas | 93.4 |
| 4th of July | 87.2 |
| Mother’s Day | 84.2 |
| Celebrate Easter | 80.7 |
| Super Bowl | 76.9 |
| Father’s Day | 75.4 |
| Thanksgiving Weekend | 73.9 |
| Halloween | 73.1 |
| St. Patrick’s Day | 61.9 |
| Valentines Day | 52.0 |
| Memorial Day Sales | 49.7 |
| Back-to-School Sales | 41.8 |
| Graduation | 33.6 |
Recent Memorial Day History
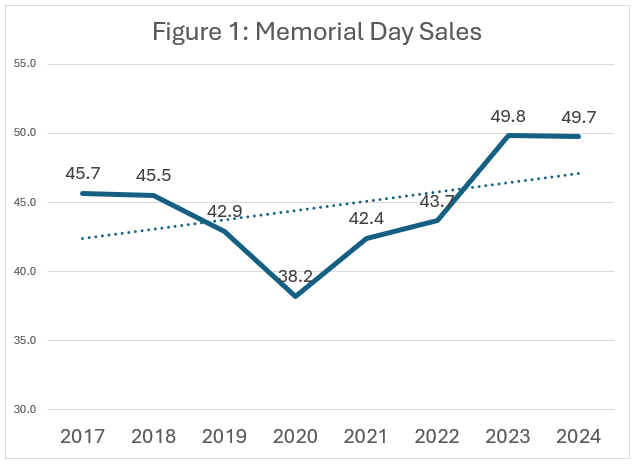
The Memorial Day sales participation celebration rate has remained the same compared to last year, as shown in Figure 1. There is a dip in 2020, no doubt related to COVID-19. The previous eight years, however, have seen an average annual increase of 0.67%.
Taking advantage of Memorial Day Sales is more complicated because it can involve different people. Table 2 shows that most participants are married, have children, have higher incomes, and are Millennials.
Table 2. Memorial Day Sales.
| Don’t | Sales | Total | Index | |
| Male | 47.2 | 46.1 | 46.7 | 98.7 |
| Female | 52.8 | 53.9 | 53.3 | 101.1 |
| Married | 36.7 | 42.3 | 39.5 | 107.1 |
| Living with Unmarried Partner | 9.6 | 9.9 | 9.8 | 101.0 |
| Divorced or separated | 14.4 | 11.4 | 12.9 | 88.4 |
| Widowed | 6.2 | 4.3 | 5.3 | 81.1 |
| Single, never married | 33.1 | 32.1 | 32.6 | 98.5 |
| Have Children | 28.2 | 37.6 | 32.9 | 114.4 |
| Income ($000) | 55.2 | 64.3 | 59.7 | 107.6 |
| Gen-Z | 16.2 | 18.6 | 17.4 | 106.9 |
| Millennials | 20.9 | 28.2 | 24.5 | 115.1 |
| Gen-X | 27.2 | 28.7 | 27.9 | 102.9 |
| Boomers | 32.1 | 22.7 | 27.4 | 82.8 |
| Seniors | 3.6 | 1.8 | 2.7 | 66.7 |
| Average Age | 50.8 | 46.4 | 48.6 | 95.4 |
| African American | 9.5 | 8.9 | 9.2 | 96.7 |
| Asian | 2.3 | 2.6 | 2.5 | 104.0 |
| Multi-Racial | 2.4 | 1.9 | 2.1 | 90.5 |
| Native American | 1.6 | 1.5 | 1.5 | 100.0 |
| White | 28.4 | 25.0 | 26.7 | 93.6 |
| Hispanic | 49.6 | 54.2 | 51.9 | 104.4 |
| Rural | 26.7 | 24.5 | 25.6 | 95.7 |
| Urban | 36.7 | 40.1 | 38.4 | 104.4 |
| Suburban | 35.7 | 34.6 | 35.2 | 98.3 |
As shown in Table 3, those who report participating in Memorial Day sales are happier across every category, especially health and their love life.
Table 3. Happiness by Memorial Day Sales.
| Don’t | Sales | Total | Index | |
| Health | 46.3 | 57.1 | 51.6 | 110.6 |
| Family | 57.4 | 67.3 | 62.3 | 108.0 |
| Friends | 55.4 | 64.5 | 59.9 | 107.6 |
| Love Life | 44.2 | 54.8 | 49.5 | 110.9 |
| Home | 56.7 | 66.8 | 61.7 | 108.2 |
| Religion | 51.5 | 59.5 | 55.4 | 107.3 |
| Work Life | 35.0 | 46.8 | 40.9 | 114.5 |
| House | 53.6 | 63.4 | 58.5 | 108.4 |
| Neighborhood | 53.4 | 62.0 | 57.7 | 107.5 |
| Composite | 47.2 | 56.6 | 51.9 | 109.2 |
Celebrating Graduation
Celebrating graduation is reported by 33.6% of adults. Of these, 18.0% report just one graduate, 8.2% report two, and 7.4% report three or more. Figure 2 shows a small decrease over the last eight years with an AGR of -.0.72%. The decline from 2023 is also somewhat sharper.
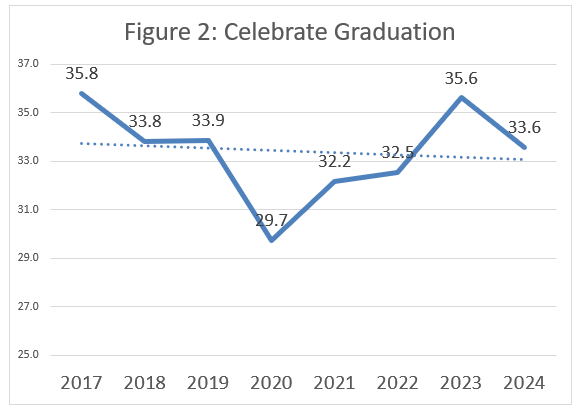
Table 4 shows the types of gifts planned for graduation celebrations. Cash is the leading choice, followed by greeting cards and gift cards. Over the prior eight years, apparel and electronics have increased despite a sharp drop in both since 2023.
Table 4. Graduation Types of Gifts.
| 2024 | Year over Year | AGR | |
| Cash | 51.7 | -0.27 | -0.33 |
| Greeting Card | 37.6 | -0.63 | -0.70 |
| Gift Card | 34.6 | 4.08 | 0.13 |
| Apparel | 15.4 | -14.30 | 0.31 |
| Electronics | 13.4 | -9.62 | 0.59 |
| Other | 4.47 | -7.55 | -0.15 |
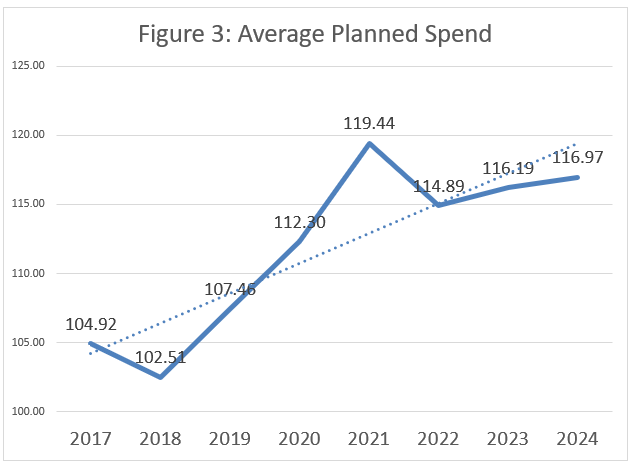
As shown in Figure 3, the planned average spending is $116.97 in 2024. The average annual growth rate for the eight years is $2.17, or 1.94%.
A description of who the graduation celebrators are is shown in Table 5. Celebrators are more likely to be married and much more likely to have children. They are also most likely to be Gen-Z or Millennial and much less likely to be white. They are also more likely to be non-rural. They also have a slightly higher income.
Table 5. Graduation Celebrators.
| Don.t | Celebrate | Total | Index | |
| Male | 45.8 | 48.3 | 46.7 | 103.4 |
| Female | 54.2 | 51.7 | 53.3 | 97.0 |
| Married | 37.5 | 43.5 | 39.5 | 110.1 |
| Living with Unmarried Partner | 9.0 | 11.3 | 9.8 | 115.3 |
| Divorced or separated | 13.7 | 11.2 | 12.9 | 86.8 |
| Widowed | 5.4 | 4.9 | 5.3 | 92.5 |
| Single, never married | 34.4 | 29.0 | 32.6 | 89.0 |
| Have Children | 25.1 | 48.2 | 32.9 | 146.5 |
| Income ($000) | 57.1 | 64.7 | 59.7 | 108.4 |
| Gen-Z | 14.2 | 23.6 | 17.4 | 135.6 |
| Millennials | 22.7 | 28.1 | 24.5 | 114.7 |
| Gen-X | 28.6 | 26.6 | 27.9 | 95.3 |
| Boomers | 31.3 | 19.8 | 27.4 | 72.3 |
| Seniors | 3.1 | 2.0 | 2.7 | 74.1 |
| Average Age | 50.4 | 45.1 | 48.6 | 92.8 |
| African American | 8.8 | 9.9 | 9.2 | 107.6 |
| Asian | 2.2 | 3.0 | 2.5 | 120.0 |
| Multi-Racial | 1.9 | 2.6 | 2.1 | 123.8 |
| Native American | 1.1 | 2.3 | 1.5 | 153.3 |
| White | 29.9 | 20.4 | 26.7 | 76.4 |
| Other | 1.8 | 2.1 | 1.9 | 110.5 |
| Hispanic | 50.4 | 54.9 | 51.9 | 105.8 |
| Rural | 26.9 | 23.1 | 25.6 | 90.2 |
| Urban | 37.6 | 39.9 | 38.4 | 103.9 |
| Suburban | 34.8 | 35.9 | 35.2 | 102.0 |
Respondents are asked to rate their overall happiness across ten categories on a five-point scale. Table 6 shows the proportion of the combination of happy and totally happy. The conclusion is that those who plan to celebrate graduation are happier than those who do not, as shown in the composite average. The biggest differences are in love life and work life.
Table 6. Graduation Celebrators Happiness.
| Don’t | Celebrate | Total | Index | |
| Health | 49.9 | 55.1 | 51.6 | 106.7 |
| Family | 61.3 | 64.4 | 62.3 | 103.3 |
| Friends | 59.3 | 61.1 | 59.9 | 101.9 |
| Love Life | 46.7 | 55.0 | 49.5 | 111.2 |
| Home | 60.5 | 64.2 | 61.7 | 104.0 |
| Religion | 53.9 | 58.5 | 55.4 | 105.5 |
| Work Life | 37.8 | 46.8 | 40.9 | 114.6 |
| House | 57.5 | 60.4 | 58.5 | 103.2 |
| Neighborhood | 56.8 | 59.3 | 57.7 | 102.9 |
| Composite | 50.2 | 55.2 | 51.9 | 106.4 |
Summary
Celebrating graduations, the day has declined slightly during the last eight years, whereas participating in Memorial Day sales have increased. Spending on graduation is increasing, while the number of gifts is decreasing slightly. The presence of children, age, marital status, and income are the strongest predictors of planning to celebrate graduation and participate in Memorial Day sales. Both celebrators and participants report being happier.