
By Melissa Nelson, Marketing and Communications, Retail Analytics Council, Northwestern University
Findings from research conducted by Prosper Insights & Analytics, in cooperation with the National Retail Federation, show that back-to-school shopping goes beyond traditional notebooks and backpacks. Back-to-school and back-to-college shopping remain two of the largest seasonal retail events of the year, with 42.4% of U.S. adults planning to make purchases for the 2026 school year. While participation has remained relatively consistent over time, the composition of spending continues to evolve.
Technology is now the largest back-to-school spending category, which accounts for an average spend of $293 per family. Families spend more on technology than clothing ($250), shoes ($174), or good old-fashioned school supplies ($146). Nearly half of back-to-school shoppers plan to purchase a laptop, highlighting how important technology has become in education.
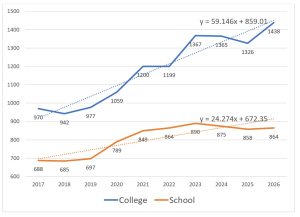
Preparing for college represents a greater financial commitment, with average spending reaching $1,438 per family, compared to $864 for K-12 families. Higher college spending is driven by purchases beyond traditional school supplies, including electronics, dorm furnishings, food, and personal care. College spending has also grown faster over the past decade, increasing by about $59 per year, compared with about $24 per year for back-to-school spending.
More than half of back-to-school shoppers plan to shop online, but many also expect to make purchases at department stores, discount retailers and specialty stores, highlighting the importance of an omnichannel shopping experience. Roughly two-thirds of shoppers also report they would consider purchasing gently used items, with saving money ranking as the top reason.
Key Findings:
- Technology generates the highest weighted spending among back-to-school purchases, while clothing and accessories are purchased by the highest percentage of shoppers (94.5%).
- Laptops are the most commonly planned electronics purchase, with 46.0% of back-to-school shoppers and 51.8% of back-to-college shoppers planning to buy one.
- More than one-third (35.4%) of back-to-school shoppers report their child wears a school uniform.
- High school is the largest school-age group represented among back-to-school shoppers (48.4%).
- Nearly one-quarter (24.3%) of college students are expected to live in off-campus housing, while 27.7% will live in dorms or college housing.
- Among shoppers considering gently used items, 28.0% cite sustainability as a reason, while 25.9% cite greater value and 17.2% cite the ability to afford higher-end brands.
Back-to-School and College Shopping Research Report
By Dr. Martin Block, Professor Emeritus, Northwestern University, Retail Analytics Council
This research was conducted by Prosper Insights & Analytics in cooperation with the National Retail Federation. Back-to-school and college are major retail events. Adults were asked in the Prosper Technologies July 2026 monthly survey (n=7,677). In response to the question, “Do you plan to shop for back-to-school/college this year?” Back-to-school and college retail spending is a multi-month event beginning for some consumers as early as late June and running through September
Overall, 42.4% reported planning to shop for back-to-school or college supplies. Of the total, 31.0% report shopping for back-to-school while 28.7% report shopping for back-to-college, including for both a dependent child and themselves. This leaves 14.1% that are shopping for both. Of those shopping for back-to-college, 14.6% say they are shopping for themselves, and 14.1% say they are shopping for a child. Historically, the percentage of people shopping for back-to-school has varied little over the last seven years.
Table 1. Seasonal Holiday Participation
| Percent | |
| Christmas | 93.4 |
| Mother’s Day | 84.2 |
| 4th of July | 83.6 |
| Celebrate Easter | 80.7 |
| Super Bowl | 76.9 |
| Father’s Day | 75.4 |
| Halloween | 73.1 |
| St. Patrick’s Day | 61.9 |
| Valentines Day | 52.0 |
| Back-to-school /College | 42.4 |
| Graduation | 33.6 |
Back-to-school and college spending averages far exceed that of all other holidays except Christmas. Figure 1 shows the annual spending trends, with college spending at $1,438 and back-to-school spending at $864. Both spending amounts are increasing over the past ten years, as shown by the linear equations. College spending is increasing faster at a rate more than double that of back-to-school spending, $59.15 versus $24.27.
Figure 1: Back-to-School and College Spend Trends
Back-to-School Spending
The average back-to-school spending is $863.96 per family. This translates to an estimated $43.3 billion for the entire country. Electronics and computers are the largest category with an average of $433 and include equipment such as a home computer, laptop, cell phone, or tablet. However, only 68% of families make such purchases, so the weighted contribution shown in Table 2 reflects spending across all back-to-school shoppers, not just those who purchased electronics. It still comprises the largest single category. As shown in Table 3, laptops and tablets lead the list. As shown in Figure 2, overall spending has increased by an average of about $24 per year since 2017. Note that the holiday spending follows a second-order polynomial, with back-to-school, college, and Christmas rounding out the year.
Table 2: Back-to-School Spending by Category
| July 2025 | Average Spend | Percent | Weighted Spend |
| Clothing and accessories | 264.78 | 94.5 | 250.29 |
| Shoes | 187.58 | 92.8 | 174.01 |
| School Supplies | 154.64 | 94.7 | 146.45 |
| Electronics/computer | 432.64 | 67.7 | 293.11 |
| Total | 863.96 |
Table 3: Types of Electronic or Computer-Related Equipment
| Laptop | 46.0 |
| Tablet | 32.4 |
| Calculator | 28.2 |
| Electronic accessories (mouse, flash drive, charger) | 25.5 |
| Smartphone/Cell phone | 23.1 |
| Home/Desktop computer | 20.7 |
| Speakers/Headphones | 18.6 |
| Printer | 11.5 |
| Smart watch/ Activity Tracker | 10.4 |
| TV | 7.9 |
| Digital camera / Digital recorder | 5.7 |
| Gaming system | 4.7 |
The most common planned purchase location is online, with over 50%, as shown in Table 4. Department stores and discount stores follow this. Note that the percentages reflect multiple categories.
Table 4: Where Will You Purchase
| Online | 50.3 |
| Department store | 46.9 |
| Discount store | 43.6 |
| Clothing store | 38.6 |
| Electronics store | 24.4 |
| Office Supplies store | 21.0 |
| Local/Small Business | 17.4 |
| Thrift Stores/Resale Shops | 8.8 |
| Drug Store | 4.7 |
| Catalog | 6.6 |
Roughly two-thirds of shoppers say they might consider gently used items, as shown in Table 5. Clothing and accessories are the largest category considered. The primary reasons are to save money and to afford higher-end and one-of-a-kind items.
Table 5: Consider Gently Used Items
| Consider Buying Gently Used | Primary Reasons | |||
| Clothing and accessories | 40.5 | Save money | 41.5 | |
| Shoes | 26.5 | Be more sustainable | 28.0 | |
| School supplies | 29.5 | Greater value | 25.9 | |
| Electronics or computer-related equipment | 22.6 | Afford higher-end brands | 17.2 | |
| None of the above | 31.0 | Find one-of-a-kind items | 11.1 | |
Back-to-school shoppers can be categorized by their children’s characteristics, including grade, whether they wear uniforms, and whether they are homeschooled. Table 6 shows the percentages by school level and wearing a uniform. Note that the school levels add to more than 100% because of multiple children. Note that over 35% report their child wears a school uniform. It is also worth noting that there are more children in high school than elementary school.
Table 6: Child Characteristics
| Elementary School | 41.5 |
| Middle School/Junior High | 38.0 |
| High School | 48.4 |
| Wear Uniform | 35.4 |
Back-to-College Spending
The pattern for back-to-college spending is like back-to-school spending. In most categories, the average spending is less except for electronics and computers, as shown in Table 7. Comparing the same four categories, clothing, shoes, supplies and electronics yields a weighted average of $1,437.79 for college as compared to $863.96 for school. Back-to-college spending represents an additional $103.5 billion. Note that only 14.1% of respondents report having a child or dependent attending college this fall. Spending on college students is substantially higher than back-to-school spending.
Table 7: Back-to-College Spending by Category
| Average Spend | Percent | Weighted Spend | |
| Clothing and accessories | 203.26 | 88.7 | 182.39 |
| Shoes | 140.63 | 86.3 | 121.37 |
| Collegiate branded gear/supplies | 142.64 | 68.7 | 98.03 |
| School Supplies | 104.37 | 93.8 | 97.88 |
| Food Items | 181.65 | 84.7 | 153.91 |
| Personal care | 150.05 | 88.9 | 133.34 |
| Electronics/computer | 461.73 | 74.1 | 341.95 |
| Dorm/apartment furnishings | 290.91 | 66.7 | 194.00 |
| Gift/pre-paid cards | 199.19 | 57.7 | 114.93 |
| Overall Total | 1437.79 | ||
Comparing Table 8 to Table 3 shows a similar pattern. Back-to-college shoppers are more likely to purchase a laptop.
Table 8: Types of Electronic or Computer-Related Equipment
| Laptop | 51.8 |
| Tablet | 26.6 |
| Electronics accessories (mouse, flash drive, charger) | 27.2 |
| Calculator | 23.1 |
| Speakers/headphones | 20.5 |
| Printer | 18.9 |
| Smartphone/cell phone | 22.9 |
| Home/desktop computer | 16.3 |
| TV | 12.9 |
| Smart watch/ activity tracker | 12.8 |
| Digital camera / digital recorder | 6.8 |
| Gaming system | 5.1 |
Online is the dominant purchase location, followed by department and discount stores, as shown in Table 9. Again, purchasers may visit more than one location. The difference for college shoppers is the addition of the college bookstore and the home décor store, since furnishings may be a separate need.
Table 9: Where Will You Purchase
| Online | 41.3 |
| Department Store | 33.0 |
| Discount Store | 32.8 |
| College Bookstore | 25.3 |
| Clothing Store | 23.1 |
| Office Supply Store | 23.7 |
| Electronics Store | 16.2 |
| Home Décor Store | 15.7 |
| Local/Small Business | 15.6 |
| Drug Store | 12.7 |
| Thrift Stores/Resale Shops | 7.8 |
| Catalog | 7.2 |
As shown in Table 10, about one in five students plan to live in off-campus housing or apartments, which may require furnishings.
Table 10: Where College Students Will Live
| At home | 33.5 |
| Dorm room or college housing | 27.7 |
| Off-campus housing | 24.3 |
| Fraternity or sorority house | 12.8 |
Summary
The breadth of spending across categories suggests opportunities for brands beyond traditional education-focused retailers. While K-12 purchases remain concentrated in clothing, shoes, school supplies, and electronics, back-to-college spending expands into categories including furnishings, food, and personal care products. Combined with consumers’ use of multiple retail channels throughout the shopping season, the data suggest back-to-school is not simply a retail event for education-focused brands. It represents a seasonal demand period that reaches a wide range of retail categories.