
By Melissa Nelson, Marketing and Communications, Retail Analytics Council, Northwestern University
Every holiday offers marketers an opportunity to better understand holiday consumer behavior. This year’s Fourth of July findings reveal insights that extend well beyond a single celebration and into the next retail season. People don’t gather because they shop. They shop because they gather. In other words, the purchases support the traditions and experiences that matter most.
July Fourth participation was strong, ranking the holiday as the second most popular American holiday after Christmas. Celebration rates for the Fourth of July have remained consistent, and the ways people celebrate have not changed much. In fact, they are not creating new rituals. They are returning to familiar gatherings with loved ones and firing up the grill to spend time together.
The data shows that July Fourth is less about buying patriotic merchandise and more about buying the food, supplies, and essentials that make the celebration possible. They are not shopping for others or the holiday itself. They are shopping to host the holiday. Unlike Christmas, where décor and gifts are purchased each season, the Fourth of July is a holiday where consumers have many of the symbolic items they need. For marketers, there is an important distinction. The opportunity may not be to convince consumers to create new traditions or simply buy products, but to help them enjoy the traditions they already have.
Applying These Insights Beyond the Fourth of July
As marketers shift to back-to-school, fall promotions and year-end holiday planning, understanding holiday consumer behavior becomes even more valuable. Specifically, they need brands that help make familiar occasions easier, more enjoyable and more memorable.
Key highlights include:
- The Fourth of July remains one of America’s most enduring traditions. It ranks as the nation’s second-most popular holiday after Christmas, with 87.0% of Americans saying they plan to celebrate.
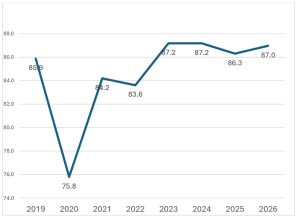
- Participation has remained remarkably consistent over the past eight years, reinforcing the staying power of established holiday traditions.
- Gathering, not traveling, defines the holiday. Interestingly, nearly two-thirds (62.4%) of celebrators planned a cookout or barbecue, while just 13.1% planned to travel.
- Many consumers already own patriotic merchandise. Overall, more than half own an American flag (56.6%), nearly half own patriotic apparel (48.5%), and 40.9% already own decorations, suggesting the holiday is built on traditions consumers have established over time.
Retail Trends, Spending, and the Fourth of July Celebratory Patterns
By Dr. Martin Block, Professor Emeritus, Northwestern University, Retail Analytics Council
The Fourth of July is the second most popular American holiday following only Christmas. Celebrating the Fourth of July is among the topics included in the Prosper Insights and Analytics monthly online surveys, research conducted in cooperation with the National Retail Federation to examine annual events and related consumer behavior. The question about celebrating the Fourth of July was asked in the June 2026 survey (n=7,675). In response to the question, “How do you plan to celebrate the Fourth of July this year?” Of the total, 13.0% said they won’t plan to celebrate the Fourth of July, leaving 87.0% who do, as shown in Table 1. The celebration rate has remained steady since the 2023 level. The level is only below Christmas. Also, June is the first month when back-to-school or college shopping is asked about, at 35.6%.
Table 1. Seasonal Holiday Participation.
| Percent | |
| Christmas | 93.4 |
| Fourth of July | 87.0 |
| Mother’s Day | 84.3 |
| Celebrate Easter | 80.7 |
| Super Bowl | 76.9 |
| Father’s Day | 75.4 |
| Halloween | 73.1 |
| St. Patrick’s Day | 61.9 |
| Valentines Day | 52.0 |
| Graduation | 35.6 |
Recent Fourth of July Celebration History
The July Fourth celebration rate has again remained relatively flat, especially over the last eight years, despite the small drop in 2025, as shown in Figure 1. In contrast, the rate dropped in 2020, no doubt related to COVID-19.
Figure 1: Celebrating Fourth of July
Celebrating the Fourth of July is more complicated because it often involves various activities. Table 2 shows that the most common activity is a cookout at 62.4%, up slightly from 2025. Fireworks follows at 44.2%. The base is the total sample. In fact, the pattern of celebration activities has changed little since 2025.
Table 2. July Fourth Celebration Activities
| 2025 | 2026 | |
| Cookout/Barbecue/Picnic | 61.3 | 62.4 |
| Fireworks/Community celebration | 45.3 | 44.2 |
| Travel/vacation | 11.7 | 13.1 |
| Attending a parade | 13.1 | 12.5 |
| Will Celebrate | 83.6 | 87.0 |
The overall average planned spend of $94.41, up from the 2025 level of $89.49, as reported for July Fourth. By comparison, $199 for Father’s Day reported last month and the $259 reported for Mother’s Day.
There is a lot of patriotic merchandise already owned, as shown in Table 3. The American flag is the leading item, followed by apparel and decorations. Almost a third (29.2%) say they are planning to purchase additional patriotic merchandise within the next 30 days. An additional 30.7% say they are unsure, and 40.1% say they are not planning any purchases.
Table 3. Patriotic Items Already Owned
| Percent | |
| American flag | 56.6 |
| Apparel (shirt, hat, etc.) | 48.5 |
| Decorations | 40.9 |
| Music | 25.6 |
| Bumper sticker or car decal | 11.2 |
| Other | 2.2 |
| Do not own patriotic merchandise | 15.0 |
Cookouts require a list of items as shown in Table 4. Another key point is that the hamburger leads the list of items at 83.98%. It is interesting that plant-based meat alternatives are only at 12.7%
Cookout Purchases Drive Holiday Spending
Table 4: Purchases for Cookout
| Percent | |
| Hamburger | 83.9 |
| Hotdogs/pork or beef brats | 75.2 |
| Chicken | 53.2 |
| Vegetables | 39.3 |
| Plant-based meat alternatives | 12.7 |
| Fish | 12.9 |
| Other | 7.3 |
Over half (59%) say they are likely to purchase plant-based items, as shown in Table 5. The reasons given are guests’ health and dietary restrictions. Also, higher prices are a reason for about half (53.8%)
Table 5: Purchase Plant-Based Alternatives and Reasons
| Percent | |
| Very likely | 31.0 |
| Somewhat likely | 28.0 |
| Somewhat unlikely | 17.6 |
| Very unlikely | 23.5 |
| Reasons | |
| Higher Prices | 53.8 |
| Health | 47.1 |
| Guests with dietary restrictions | 28.6 |
| Climate change | 19.2 |
| Other | 4.4 |
Recycled materials for disposables are a strong reason to purchase them for the celebration. For example, this includes recyclables, made from recyclable material and compostable.
Table 6: When Buying Disposables, What Do You Look For
| Percent | |
| Recyclable | 52.8 |
| Made from recycled materials | 39.7 |
| Compostable | 25.1 |
| Do not purchase these for my celebrations | 19.1 |
July Fourth Celebrators
July Fourth celebrator descriptions are shown in Table 7. The comparison is based on their planned celebration in 2026. About 87.0% report a plan to celebrate. The 13.0% that don’t celebrate are in the “Don’t” column. To facilitate comparison, an index is computed by dividing the percentage of those who don’t celebrate by the total. Table 7 shows that celebrators are more likely to be male, noting that those who are not celebrating are ranked lower. Those who are married, have children and are either Gen-Z or Millennial are more likely to celebrate the Fourth of July. By comparison, those who are divorced or widowed and Boomers or Seniors are less likely to celebrate. In addition, celebrators also have higher incomes.
Table 7. Celebrator Demographics.
| Celebrate | Don’t | Total | Don’t Index | |
| Male | 48.7 | 43.1 | 48.0 | 89.8 |
| Female | 51.3 | 56.9 | 52.0 | 109.4 |
| Married | 38.7 | 29.1 | 37.4 | 77.8 |
| Living with Unmarried Partner | 8.2 | 6.8 | 8.0 | 85.0 |
| Divorced or separated | 12.4 | 17.8 | 13.1 | 135.9 |
| Widowed | 5.1 | 8.3 | 5.5 | 150.9 |
| Single, never married | 32.4 | 36.8 | 33.0 | 111.5 |
| Have Children | 38.1 | 15.0 | 35.1 | 42.7 |
| Gen-Z | 21.8 | 13.0 | 20.7 | 62.8 |
| Millennials | 27.0 | 16.2 | 25.6 | 63.3 |
| Gen-X | 26.6 | 30.6 | 27.2 | 112.5 |
| Boomers | 22.9 | 36.0 | 24.6 | 146.3 |
| Seniors | 1.7 | 4.1 | 2.0 | 205.0 |
| Average Age | 47.9 | 54.8 | 48.8 | 112.4 |
| Average Income | 64.8 | 51.8 | 63.1 | 82.1 |
| African American | 17.7 | 17.7 | 17.7 | 100.0 |
| Asian | 4.6 | 3.7 | 4.5 | 82.2 |
| Multi-Racial | 1.8 | 2.4 | 1.9 | 126.3 |
| Native American | 1.3 | 1.3 | 1.3 | 100.0 |
| White | 56.4 | 59.9 | 56.8 | 105.5 |
| Other | 0.7 | 1.4 | 0.8 | 175.0 |
| Hispanic | 15.3 | 12.6 | 14.9 | 84.6 |
| Rural | 23.4 | 24.8 | 23.6 | 105.1 |
| Urban | 40.7 | 40.3 | 40.7 | 99.0 |
| Suburban | 35.1 | 34.6 | 35.0 | 98.9 |
Happiness
Next, respondents rated their overall happiness across ten categories on a five-point scale. Table 8 shows the proportion of respondents who selected “happy” or “totally happy”. Notably, those who plan to celebrate the Fourth of July are happier than those who do not, as shown in the composite average. The biggest differences are in love life, work life, and government, as seen among Easter, Mother’s Day and Father’s Day celebrators.
Table 8. Happiness by July Fourth Celebration.
| Celebrate | Don’t | Total | Don’t Index | |
| Health | 58.0 | 42.0 | 55.9 | 75.0 |
| Family | 65.6 | 49.8 | 63.5 | 78.3 |
| Friends | 63.3 | 48.0 | 61.3 | 78.4 |
| Love Life | 54.0 | 37.2 | 51.8 | 71.8 |
| Home | 64.9 | 52.0 | 63.3 | 82.2 |
| Religion | 59.7 | 45.3 | 57.9 | 78.3 |
| Work Life | 45.9 | 30.0 | 43.9 | 68.4 |
| House | 61.8 | 48.3 | 60.0 | 80.5 |
| Neighborhood | 59.6 | 47.2 | 58.0 | 81.4 |
| Government | 29.9 | 13.4 | 27.8 | 48.1 |
| Composite | 56.3 | 41.3 | 54.3 | 76.0 |
Summary
The Fourth of July continues to be one of the nation’s most stable seasonal celebrations. Despite changes in the economy and retail environment, participation has remained high and celebration habits have changed very little. Consumers already own many of the traditional symbols of the holiday, with spending focused primarily on the food and essentials needed to bring people together.
Participation is strongest among married households, families with children, and younger generations, reinforcing the community-centered celebrations rooted in shared traditions. Additionally, those who celebrated also reported higher levels of happiness as well. As retailers look toward the next seasonal events, the findings reinforce how holiday consumer behavior differs from everyday purchasing decisions.